The structure of Fcp1, an essential RNA polymerase II CTD phosphatase - PubMed (original) (raw)
The structure of Fcp1, an essential RNA polymerase II CTD phosphatase
Agnidipta Ghosh et al. Mol Cell. 2008.
Abstract
Kinases and phosphatases regulate mRNA synthesis and processing by phosphorylating and dephosphorylating the C-terminal domain (CTD) of the largest subunit of RNA polymerase II. Fcp1 is an essential CTD phosphatase that preferentially hydrolyzes Ser2-PO(4) of the tandem YSPTSPS CTD heptad array. Fcp1 crystal structures were captured at two stages of the reaction pathway: a Mg-BeF(3) complex that mimics the aspartylphosphate intermediate and a Mg-AlF(4)(-) complex that mimics the transition state of the hydrolysis step. Fcp1 is a Y-shaped protein composed of an acylphosphatase domain located at the base of a deep canyon formed by flanking modules that are missing from the small CTD phosphatase (SCP) clade: an Fcp1-specific helical domain and a C-terminal BRCA1 C-terminal (BRCT) domain. The structure and mutational analysis reveals that Fcp1 and Scp1 (a Ser5-selective phosphatase) adopt different CTD-binding modes; we surmise the CTD threads through the Fcp1 canyon to access the active site.
Figures
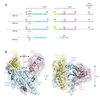
Figure 1. Fcp1 structure and domain organization
A) S. pombe, S. cerevisiae, and H. sapiens Fcp1 family members aligned to H. sapiens Scp1. Amino acid positions numbered with domains color-coded: FCPH domains (blue), insertion domains (yellow), the linker helix between FCPH and BRCT domains (green), and BRCT domains (pink). Blue boxes indicate the TFIIF interaction helix position in ScFcp1 and HsFcp1. Question mark indicates that it is unknown whether SpFcp1 interacts with SpTFIIF. B) Orthogonal views of the Fcp1(140–580) structure as a ribbon with arrows for β-strands and wide-ribbons for helices. A transparent molecular surface envelops the Fcp1 structure. Domains colored as in (A). Helices in the yellow helical insertion domain are labeled (Fig. 2). N and C denote amino- and carboxy- termini. Asp170-BeF3 (stick representation) indicates the position of the Fcp1 active site. Arrows and distances denote the dimensions of the canyon.
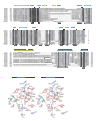
Figure 2. Primary structure and mutational effects on Fcp1 function in vitro
A) Aligned amino acid sequences for Fcp1 FCPH domains from S. pombe, S. cerevisiae, C. albicans, D. melanogaster, C. elegans, H. sapiens, M. musculus, X. laevis, A. thaliana, and E. cuniculi and H.sapiens Scp1. SpFcp1 and Scp1 secondary structure elements are color-coded as in Fig. 1 above the sequence or shown in grey below the sequence, respectively (helices as bars; strands as arrows). Short alignment gaps indicated by (−). The disordered 72-amino acid loop (SpFcp1 aa 326-397) denoted as a break (//) in the alignment. Results of previous and current mutational analysis of SpFcp1 are indicated by circles above selected amino acids colored according to the relative activities of the respective mutants as specified by the color bar above panel B. B) Stereo diagram of the Fcp1 active site depicting amino acids subjected to mutational analysis. Side chains as sticks color-coded according to the phosphatase activity of the respective alanine mutant. Magnesium and water are depicted as blue and red spheres, respectively. Atomic contacts indicated by dashed lines. The polypeptide backbone is represented by a thin ribbon.
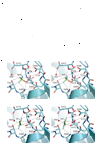
Figure 3. CTD dephosphorylation and close-up views of the Fcp1 active site
A) Two-step Fcp1 reaction pathway. Step 1 is the attack of the active-site aspartate on the phosphorus of phospho-CTD to form an acylphosphate intermediate. Step 2 entails a nucleophilic attack by water on the acylphosphate, resulting in formation of the inorganic phosphate product. B) Stereo view of the active site of Fcp1-Mg-BeF3 complex that mimics the acylphosphate intermediate. C) Stereo view of the Fcp1-Mg-AlF4 − complex that mimics the step 2 transition state. Side chains are depicted in stick representation; Mg and water are denoted by blue and red spheres, respectively. The proposed nucleophilic water is labeled Wat*. Atomic contacts indicated by dashed lines.
Figure 4. Fcp1 BRCT domain and comparison to BRCA1
A) Structure-based amino acid alignment of the SpFcp1 BRCT domain to the proximal BRCT domain of human BRCA1 protein expanded to include BRCT domains of nine other Fcp1 orthologs with SpFcp1 secondary structure elements above the sequence. Gaps indicated by (−). Side chain identity/similarity denoted by shading (black conserved in all; grey conserved in most). BRCA1 amino acids that coordinate the phosphoserine residue of BRCH1 (panel B) outlined in red. Results of mutational analysis indicated by color-coded circles as in Fig. 2. B) Ribbon diagram for SpFcp1 BRCT (left) and human BRCA1 tandem BRCT domains bound to a BRCH1 phosphopeptide (green; phospho-serine stick representation; PDB 1T29). N and C indicate N- and C-terminal residues for BRCT domains, respectively. C) Close-up views of the putative phosphopeptide binding site in SpFcp1 and the actual phosphoserine binding site in BRCA1. Side chain contacts to phosphoserine shown as dashed lines. D) Phosphatase activities of wild-type Fcp1 and Fcp1-S499A/T542V/K544A with triheptad S2P and S5P CTD substrates. Error bars (one standard deviation) calculated from three independent experiments performed in triplicate. E) Serial dilutions of S. cerevisiae fcp1Δ strains bearing indicated FCP1 alleles spotted on YPAD agar grown at 23°C (top), 30°C (middle), and 37°C (bottom).
Figure 5. Insights to CTD recognition
A) Surface representations for SpFcp1 with domains colored as in Fig. 1. A red asterisk indicates the active site Asp170-BeF3-Mg. Proposed CTD path through the Fcp1 canyon indicated by a dashed line. B) Surface representation for the Scp1-CTD complex (Zhang et al., 2006; PDB 2GHT) aligned to SpFcp1 in A. The S5P-CTD ligand is depicted as a stick model with its N and C termini labeled. The dashed arrow indicates the CTD path on the Scp1 surface.
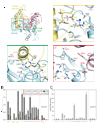
Figure 6. Structure-guided mutational analysis of Fcp1
A) Ribbon trace of the SpFcp1 fold with domains colored as in Fig. 1. Yellow, green and red boxes outline three regions selected for mutational analysis; side chains selected for mutation are indicated by colored-coded labels in yellow, green or red. B) Specific activities of wild-type and mutant SpFcp1 for release of phosphate from 50 µM triheptad S2P and S5P CTD substrates. Residue labels on the x-axis are color-coded by regions as in A. Asterisk denote specific activity at pH 6.5. Error bars (one standard deviation) calculated from three independent experiments performed in triplicate (Fig. S1). C) CTD substrate preferences are indicated by plotting the S2P/S5P activity ratios calculated using data in panel B.
Similar articles
- An encephalitozoon cuniculi ortholog of the RNA polymerase II carboxyl-terminal domain (CTD) serine phosphatase Fcp1.
Hausmann S, Schwer B, Shuman S. Hausmann S, et al. Biochemistry. 2004 Jun 8;43(22):7111-20. doi: 10.1021/bi0499617. Biochemistry. 2004. PMID: 15170348 - Genetic and structural analysis of the essential fission yeast RNA polymerase II CTD phosphatase Fcp1.
Schwer B, Ghosh A, Sanchez AM, Lima CD, Shuman S. Schwer B, et al. RNA. 2015 Jun;21(6):1135-46. doi: 10.1261/rna.050286.115. Epub 2015 Apr 16. RNA. 2015. PMID: 25883047 Free PMC article. - Structure and mechanism of RNA polymerase II CTD phosphatases.
Kamenski T, Heilmeier S, Meinhart A, Cramer P. Kamenski T, et al. Mol Cell. 2004 Aug 13;15(3):399-407. doi: 10.1016/j.molcel.2004.06.035. Mol Cell. 2004. PMID: 15304220 - A structural perspective of CTD function.
Meinhart A, Kamenski T, Hoeppner S, Baumli S, Cramer P. Meinhart A, et al. Genes Dev. 2005 Jun 15;19(12):1401-15. doi: 10.1101/gad.1318105. Genes Dev. 2005. PMID: 15964991 Review. - CTD phosphatase: role in RNA polymerase II cycling and the regulation of transcript elongation.
Lin PS, Marshall NF, Dahmus ME. Lin PS, et al. Prog Nucleic Acid Res Mol Biol. 2002;72:333-65. doi: 10.1016/s0079-6603(02)72074-6. Prog Nucleic Acid Res Mol Biol. 2002. PMID: 12206456 Review.
Cited by
- Mechanism of RNA 2',3'-cyclic phosphate end healing by T4 polynucleotide kinase-phosphatase.
Das U, Shuman S. Das U, et al. Nucleic Acids Res. 2013 Jan 7;41(1):355-65. doi: 10.1093/nar/gks977. Epub 2012 Oct 30. Nucleic Acids Res. 2013. PMID: 23118482 Free PMC article. - Protein phosphatases of Saccharomyces cerevisiae.
Offley SR, Schmidt MC. Offley SR, et al. Curr Genet. 2019 Feb;65(1):41-55. doi: 10.1007/s00294-018-0884-y. Epub 2018 Sep 17. Curr Genet. 2019. PMID: 30225534 Free PMC article. Review. - BRCT Domains: Structure, Functions, and Implications in Disease-New Therapeutic Targets for Innovative Drug Discovery against Infections.
Peña-Guerrero J, Fernández-Rubio C, García-Sosa AT, Nguewa PA. Peña-Guerrero J, et al. Pharmaceutics. 2023 Jun 27;15(7):1839. doi: 10.3390/pharmaceutics15071839. Pharmaceutics. 2023. PMID: 37514027 Free PMC article. Review. - Dephosphorylation of the C-terminal tyrosyl residue of the DNA damage-related histone H2A.X is mediated by the protein phosphatase eyes absent.
Krishnan N, Jeong DG, Jung SK, Ryu SE, Xiao A, Allis CD, Kim SJ, Tonks NK. Krishnan N, et al. J Biol Chem. 2009 Jun 12;284(24):16066-16070. doi: 10.1074/jbc.C900032200. Epub 2009 Apr 7. J Biol Chem. 2009. PMID: 19351884 Free PMC article. - Diverse Functions of Tim50, a Component of the Mitochondrial Inner Membrane Protein Translocase.
Chaudhuri M, Tripathi A, Gonzalez FS. Chaudhuri M, et al. Int J Mol Sci. 2021 Jul 21;22(15):7779. doi: 10.3390/ijms22157779. Int J Mol Sci. 2021. PMID: 34360547 Free PMC article. Review.
References
- Buratowski S. The CTD code. Nature Struct. Biol. 2003;10:679–680. - PubMed
- Burroughs AM, Allen KN, Dunaway-Mariano D, Aravind L. Evolutionary genomics of the HAD superfamily: understanding the structural adaptations and catalytic diversity in a superfamily of phosphoesterases and allied enzymes. J. Mol. Biol. 2006;361:1003–1034. - PubMed
- Chambers RS, Kane CM. Purification and characterization of an RNA polymerase II phosphatase from yeast. J. Biol. Chem. 1996;271:24498–24504. - PubMed
Publication types
MeSH terms
Substances
Grants and funding
- R01 GM052470/GM/NIGMS NIH HHS/United States
- R01 GM061906/GM/NIGMS NIH HHS/United States
- GM61906/GM/NIGMS NIH HHS/United States
- P41 RR015301/RR/NCRR NIH HHS/United States
- RR-15301/RR/NCRR NIH HHS/United States
- GM52470/GM/NIGMS NIH HHS/United States
LinkOut - more resources
Full Text Sources
Other Literature Sources
Molecular Biology Databases
Miscellaneous


