Stimulus contrast modulates functional connectivity in visual cortex - PubMed (original) (raw)
Stimulus contrast modulates functional connectivity in visual cortex
Ian Nauhaus et al. Nat Neurosci. 2009 Jan.
Abstract
Neurons in visual cortex are linked by an extensive network of lateral connections. To study the effect of these connections on neural responses, we recorded spikes and local field potentials (LFPs) from multi-electrode arrays that were implanted in monkey and cat primary visual cortex. Spikes at each location generated outward traveling LFP waves. When the visual stimulus was absent or had low contrast, these LFP waves had large amplitudes and traveled over long distances. Their effect was strong: LFP traces at any site could be predicted by the superposition of waves that were evoked by spiking in a approximately 1.5-mm radius. As stimulus contrast increased, both the magnitude and the distance traveled by the waves progressively decreased. We conclude that the relative weight of feedforward and lateral inputs in visual cortex is not fixed, but rather depends on stimulus contrast. Lateral connections dominate at low contrast, when spatial integration of signals is perhaps most beneficial.
Figures
Figure 1
Spike-triggered LFPs as a measure of functional connectivity. (a) The spike-triggered average of the LFP signal at different locations in the array is shown. The array consisted of a 10 × 10 array of electrodes, but the corners were not wired, resulting in 96 active electrodes. Grid separation was 400 μm between adjacent electrodes. In this example, reference spikes originated from the electrode that is indicated by the circle. The spike-triggered LFP average across the entire array is shown by the traces. The calculation of spike-triggered LFPs was repeated for all possible reference locations. (b) Measurements of the spike-triggered LFP. For each spike-triggered LFP average, we computed two parameters: the maximum peak (negative) deflection and the time at which it peaked. From these data, we analyzed how the amplitude and time to peak depended on the cortical distance between the reference spike location and the target LFP location.
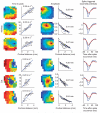
Figure 2
Spikes initiate traveling waves of LFPs in the cortex. Examples are shown from one array that was implanted in monkey V1 (top) and one penetration in cat V1 (bottom). Each row depicts data from the spike-triggered LFPs from a single spiking location. Left, the dependence of time to peak as a function of cortical distance from the triggering electrode is shown, both as an image (left) and as a scatter plot (right). Middle, the amplitudes of the signals are shown in a pseudo-color map to the left (the location of the reference spike corresponds to that of the darkest red–saturated pixel) and scatter plots of amplitude versus distance obtained by re-plotting the data are shown on the right. Estimated space constants appear at the inset. Estimated propagation velocities appear at the inset. Right, curves representing average LFP waveforms at three different distances from the location of the reference spikes are shown. The blue curve is the waveform at the spike location. The gray curve is the average waveform at distances of ≥400 μm and <2,400 μm, and each red curve is the average at a distance of ≥2,400 μm and <3,600 μm. The dependence of magnitude and time to peak are evident in these average curves.
Figure 3
Predictions of LFPs from the spiking activity across a neuronal population. (a) Predictions for the LFP were generated on the basis of the linear superposition of the traveling waves induced by spikes across the entire array. Shown here are two examples of measured (black) and predicted (red) LFPs at one site in a cat and monkey. The vertical bar represents 2 s.d. of the LFP. (b) The predictions improved as the integration region, centered on the target LFP location, increased. The maximum amount of variance accounted for saturated for regions over ∼1.2 mm in radius. Error bars represent ± s.e.m. (c) Predictions best captured the low temporal-frequency components of the LFP. The graph shows the coherence between measured and predicted responses in the monkey and cat. Coherence was largest in the band between 2 and 15 Hz and decreased steadily to reach a baseline level at ∼35 Hz.
Figure 4
Sites with similar orientation preference are more strongly linked than sites with dissimilar orientation preference. The abscissa represents the absolute difference in orientation between the reference site and the site of the spike-triggered LFP. The ordinate corresponds to residual z-score values of the amplitude after subtracting the distance dependence predicted by the exponential fits. Plotted are the mean and standard error bars for three different bins of orientation difference. Two of the bins were plotted twice to make the curve symmetric solely for presentation purposes.
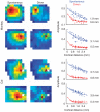
Figure 5
Visual stimulation modifies the effective lateral connectivity in the cortex. Each row shows the dependence of the spike-triggered LFP amplitudes as a pseudo-color image in spontaneous and driven conditions and as scatter plots. The top two examples correspond to two different monkeys. The bottom two are from two different cats. The solid curves in the scatter plot are best exponential fits to the data and the estimated space constants appear at the inset.
Figure 6
Effect of contrast on the magnitude and spatial extent of lateral interactions. (a) Histograms of the ratio of space constants λspontλdriven (top) and the ratio of magnitudes MspontMdriven (bottom). The effect was robust and similar in both monkeys and cats. The average ratio is shown at the inset of each histogram. (b) Smooth dependence on contrast. The plots show the mean values of the space constant and magnitude for three different contrast levels: 0 (spontaneous), 25 and 100% contrast. These represent the average behavior in two monkeys. Error bars represent ± s.e.m.
Figure 7
Results are unchanged by triggering on multi-unit or single-unit activity. In those cases where single-unit activity could be well isolated, we obtained results that were very similar to those obtained using multi-unit activity as the triggering events. The figure shows kernels obtained by triggering with well-isolated cells. These should be compared to those obtained with multi-unit activity in the middle panels of Figure 5.
Figure 8
Correlation between pairs of LFP signals shows a contrast dependence that is similar to spike-triggered averaging of LFPs. The graphs depict the correlation coefficients between LFPs as a function of cortical distance for spontaneous and driven stimulus conditions. The correlation coefficients fell off more rapidly with cortical distance in the driven condition (100% contrast full-field drifting gratings) than in the spontaneous case. Error bars represent ± s.e.m.
Comment in
- Spikes are making waves in the visual cortex.
Swadlow HA, Alonso JM. Swadlow HA, et al. Nat Neurosci. 2009 Jan;12(1):10-1. doi: 10.1038/nn0109-10. Nat Neurosci. 2009. PMID: 19107144 No abstract available.
Similar articles
- Coding of image contrast in central visual pathways of the macaque monkey.
Sclar G, Maunsell JH, Lennie P. Sclar G, et al. Vision Res. 1990;30(1):1-10. doi: 10.1016/0042-6989(90)90123-3. Vision Res. 1990. PMID: 2321355 - Network rhythms influence the relationship between spike-triggered local field potential and functional connectivity.
Ray S, Maunsell JH. Ray S, et al. J Neurosci. 2011 Aug 31;31(35):12674-82. doi: 10.1523/JNEUROSCI.1856-11.2011. J Neurosci. 2011. PMID: 21880928 Free PMC article. - Top-down modulation of lateral interactions in visual cortex.
Ramalingam N, McManus JN, Li W, Gilbert CD. Ramalingam N, et al. J Neurosci. 2013 Jan 30;33(5):1773-89. doi: 10.1523/JNEUROSCI.3825-12.2013. J Neurosci. 2013. PMID: 23365217 Free PMC article. - Response facilitation from the "suppressive" receptive field surround of macaque V1 neurons.
Ichida JM, Schwabe L, Bressloff PC, Angelucci A. Ichida JM, et al. J Neurophysiol. 2007 Oct;98(4):2168-81. doi: 10.1152/jn.00298.2007. Epub 2007 Aug 8. J Neurophysiol. 2007. PMID: 17686908
Cited by
- Reconciliation of weak pairwise spike-train correlations and highly coherent local field potentials across space.
Senk J, Hagen E, van Albada SJ, Diesmann M. Senk J, et al. Cereb Cortex. 2024 Oct 3;34(10):bhae405. doi: 10.1093/cercor/bhae405. Cereb Cortex. 2024. PMID: 39462814 Free PMC article. - Stochastic Network Models in Neuroscience: A Festschrift for Jack Cowan. Introduction to the Special Issue.
Bressloff PC, Ermentrout B, Faugeras O, Thomas PJ. Bressloff PC, et al. J Math Neurosci. 2016 Dec;6(1):4. doi: 10.1186/s13408-016-0036-y. Epub 2016 Apr 4. J Math Neurosci. 2016. PMID: 27043152 Free PMC article. - Synchronization through nonreciprocal connections in a hybrid hippocampus microcircuit.
Hilscher MM, Leão KE, Leão RN. Hilscher MM, et al. Front Neural Circuits. 2013 Jul 23;7:120. doi: 10.3389/fncir.2013.00120. eCollection 2013. Front Neural Circuits. 2013. PMID: 23888129 Free PMC article. - VIOLA-A Multi-Purpose and Web-Based Visualization Tool for Neuronal-Network Simulation Output.
Senk J, Carde C, Hagen E, Kuhlen TW, Diesmann M, Weyers B. Senk J, et al. Front Neuroinform. 2018 Nov 8;12:75. doi: 10.3389/fninf.2018.00075. eCollection 2018. Front Neuroinform. 2018. PMID: 30467469 Free PMC article. - Synchronization dynamics in response to plaid stimuli in monkey V1.
Lima B, Singer W, Chen NH, Neuenschwander S. Lima B, et al. Cereb Cortex. 2010 Jul;20(7):1556-73. doi: 10.1093/cercor/bhp218. Epub 2009 Oct 7. Cereb Cortex. 2010. PMID: 19812238 Free PMC article.
References
- Reid RC, Alonso JM. Specificity of monosynaptic connections from thalamus to visual cortex. Nature. 1995;378:281–284. - PubMed
- Priebe NJ, Ferster D. Inhibition, spike threshold and stimulus selectivity in primary visual cortex. Neuron. 2008;57:482–497. - PubMed
- Ferster D, Chung S, Wheat H. Orientation selectivity of thalamic input to simple cells of cat visual cortex. Nature. 1996;380:249–252. - PubMed
- Ferster D, Miller KD. Neural mechanisms of orientation selectivity in the visual cortex. Annu. Rev. Neurosci. 2000;23:441–471. - PubMed
- Chung S, Ferster D. Strength and orientation tuning of the thalamic input to simple cells revealed by electrically evoked cortical suppression. Neuron. 1998;20:1177–1189. - PubMed
Publication types
MeSH terms
Grants and funding
- R01 EY018322-01/EY/NEI NIH HHS/United States
- R01 EY012816-01/EY/NEI NIH HHS/United States
- R01 EY017396/EY/NEI NIH HHS/United States
- R01 EY012816/EY/NEI NIH HHS/United States
- EY-12816/EY/NEI NIH HHS/United States
- R01 EY017396-01/EY/NEI NIH HHS/United States
- R01 EY018322/EY/NEI NIH HHS/United States
- EY-18322/EY/NEI NIH HHS/United States
- EY-17396/EY/NEI NIH HHS/United States
LinkOut - more resources
Full Text Sources
Other Literature Sources
Research Materials
Miscellaneous


