Receptor architecture of human cingulate cortex: evaluation of the four-region neurobiological model - PubMed (original) (raw)
Receptor architecture of human cingulate cortex: evaluation of the four-region neurobiological model
Nicola Palomero-Gallagher et al. Hum Brain Mapp. 2009 Aug.
Abstract
The structural and functional organization of the human cingulate cortex is an ongoing focus; however, human imaging studies continue to use the century-old Brodmann concept of a two region cingulate cortex. Recently, a four-region neurobiological model was proposed based on structural, circuitry, and functional imaging observations. It encompasses the anterior cingulate, midcingulate, posterior cingulate, and retrosplenial cortices (ACC, MCC, PCC, and RSC, respectively). For the first time, this study performs multireceptor autoradiography of 15 neurotransmitter receptor ligands and multivariate statistics on human whole brain postmortem samples covering the entire cingulate cortex. We evaluated the validity of Brodmann's duality concept and of the four-region model using a hierarchical clustering analysis of receptor binding according to the degree of similarity of each area's receptor architecture. We could not find support for Brodmann's dual cingulate concept, because the anterior part of his area 24 has significantly higher AMPA, kainate, GABA(B), benzodiazepine, and M(3) but lower NMDA and GABA(A) binding site densities than the posterior part. The hierarchical clustering analysis distinguished ACC, MCC, PCC, and RSC as independent regions. The ACC has highest AMPA, kainate, alpha(2), 5-HT(1A), and D(1) but lowest GABA(A) densities. The MCC has lowest AMPA, kainate, alpha(2), and D(1) densities. Area 25 in ACC is similar in receptor-architecture to MCC, particularly the NMDA, GABA(A), GABA(B), and M(2) receptors. The PCC and RSC differ in the higher M(1) and alpha(1) but lower M(3) densities of PCC. Thus, multireceptor autoradiography supports the four-region neurobiological model of the cingulate cortex.
(c) 2008 Wiley-Liss, Inc.
Figures
Figure 1
Summary of the algorithm‐based observer interactive method applied to determine cortical borders. A. Digitized autoradiograph of a coronal section through the cingulate gyrus in which the M 1 receptors were labeled with [3H]pirenzepine. B. Linearized image shown in A. C. Two contour lines (white) define the cortical region to be sampled in the image shown in B by profiles spanning the ribbon. The outer contour marks the pial surface, the inner contour the layer VI/white matter border. Each of the equidistant traverses (red lines) marks the location of a profile. The green symbols indicate the start (asterisks) and end (crosses) points of every tenth profile. D. Distance analysis based on profiles indicated in C. Asterisks highlight main maxima with significant P values (P < 0.01, interareal borders) at positions 53, 130, 209, and 282. E. Result of the algorithm‐based border detection applied to the section shown in A. Red lines highlight the profile identified by the distance analysis as an interareal border and numbers in the white circles indicate the number of the profile in question. Thus, profile 53 defines the border between areas a24a′ and a24b′; profile 130 that between areas a24b′ and 24c′v; profile 209 that between areas 24c′v and 24c′d; profile 282 that between areas 24c′d and 32′.
Figure 2
The cingulate cortex as defined by Brodmann [1909]. A. Schematic drawing showing the regions, subregions and areas defined by Brodmann within the human cingulate cortex. The precingulate subregion encompasses areas 33, 25, 24, and 32; the postcingulate subregion areas 23 and 31; the retrosplenial region areas 29 and 30. The callosal (cas), cingulate (cgs), paracingulate (pcgs), and splenial (spls) sulci were “opened” to show areas within them. B. Result of the hierarchical clustering of cingulate regions defined by Brodmann based on their neurochemical structure. The length of the branches indicates the degree of (dis)similarity between the joined clusters. The shorter the branch, the more similar two elements or groups of elements are. The mean receptor densities of area 24 used in this analysis were obtained by averaging all profiles located between white lines in C. C. Coronal sections through two different rostrocaudal levels of area 24 showing the distribution of the GABAA (top row) and AMPA (bottom row) receptors. Lines indicate the position of borders detected by the algorithm‐based quantification of cortical receptor profiles. White lines indicate the borders of area 24 as defined by Brodmann. Black lines highlight borders detected within Brodmann's area 24. The lines are continuous when the receptor in question reveals the border and dotted when the border is revealed by other receptors (for example, receptors shown in Levels 1 [anterior 24] and 3 [posterior 24] of Fig. 3B). Colour scales code receptor densities in fmol/mg protein. D. Heterogeneous distribution of receptors throughout the rostrocaudal axis of area 24 as revealed by the asymmetry index (AIa/p). The mean receptor densities used in this analysis were obtained by averaging all profiles located between white lines in C and extracted from sections covering the rostral third (A a value) or the caudal two thirds (A p) of area 24. Positive AIa/p values indicate higher densities of the receptor in question in the rostral than in the caudal third of area 24. An AIa/p of 0 (expected value) indicates a homogeneous receptor distribution. Asterisks indicate those receptors for which AIa/p values differ significantly (P ≤ 0.01) from 0.
Figure 3
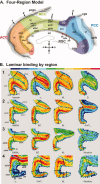
A. The four‐region neurobiological model and cytoarchitectural areas [Vogt et al.,2004]. The callosal, cingulate (cgs), paracingulate (pcgs) and splenial sulci were “opened” to show areas within them. The ACC areas (33, 25, 24a, 24b, 24cv, 24cd, and 32) are coded in red; MCC areas (33, a24a′, a24b′, a24c′v, a24c′d, p24a′, p24b′, 24dv, 24dd) in green; PCC areas (23d, 23c, d23, v23, 31) in blue; and RSC areas (29l, 29m, 30) in gray. Arrowheads mark the four levels at which autoradiographs shown below were obtained. B. Exemplary autoradiographs through four rostrocaudal levels of the human cingulate gyrus. Lines indicate the position of borders detected by the algorithm‐based quantification of cortical receptor profiles. The lines are continuous when the receptor in question reveals the border and dotted when the border is revealed by other receptors. Note, that layer I is partially missing in area 24b, as clearly shown by the α1 receptors (B1: top row of autoradiographs).
Figure 4
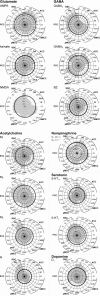
Mean binding site densities (fmol/mg protein; values averaged over all cortical layers) of the 15 receptors displayed as polar coordinate plots. The thick black line in each polar coordinate plot shows the average receptor density of that receptor across all areas. This average value of the α2 receptor is indicated by a dashed‐black line. Areas containing receptor densities significantly higher or lower than the average density of that across all areas are highlighted for each receptor type in bold and underlined. Highlighted areas in the plot showing α1 and α2 receptors indicate significances for the α1 receptor. In the case of the α2 receptor only densities of area 24b differed significantly from the average. Although for 5‐HT1A receptor areal differences from the mean did not reach significance at P < 0.01, they showed a clear tendency to be higher than the average in areas 25 (P = 0.03) and a24a′ (P = 0.03), but lower in areas 24c′d (P = 0.02), v23 (P = 0.02) and 29l (P = 0.02).
Figure 5
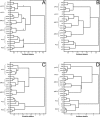
Hierarchical clustering of cingulate regions based on their neurochemical structure. A. Result of the clustering analysis carried out including all receptors and all areas. B. Result of the clustering analysis carried out with all receptors, but excluding RSC areas (29l, 29m, and 30). C. Result of the clustering analysis carried out using all areas but excluding NMDA, GABAA, GABAB, and 5‐HT1A receptors, because their densities in area 25 differ significantly from those of all other ACC areas. D. Result of the clustering analysis carried out using all areas, but only the NMDA, GABAA, GABAB, and 5‐HT1A receptors.
Similar articles
- Distributions of transmitter receptors in the macaque cingulate cortex.
Bozkurt A, Zilles K, Schleicher A, Kamper L, Arigita ES, Uylings HB, Kötter R. Bozkurt A, et al. Neuroimage. 2005 Mar;25(1):219-29. doi: 10.1016/j.neuroimage.2004.10.040. Epub 2005 Jan 4. Neuroimage. 2005. PMID: 15734357 - Cytology and receptor architecture of human anterior cingulate cortex.
Palomero-Gallagher N, Mohlberg H, Zilles K, Vogt B. Palomero-Gallagher N, et al. J Comp Neurol. 2008 Jun 20;508(6):906-26. doi: 10.1002/cne.21684. J Comp Neurol. 2008. PMID: 18404667 Free PMC article. - Subdivisions of human parietal area 5 revealed by quantitative receptor autoradiography: a parietal region between motor, somatosensory, and cingulate cortical areas.
Scheperjans F, Grefkes C, Palomero-Gallagher N, Schleicher A, Zilles K. Scheperjans F, et al. Neuroimage. 2005 Apr 15;25(3):975-92. doi: 10.1016/j.neuroimage.2004.12.017. Neuroimage. 2005. PMID: 15808998 - Midcingulate cortex: Structure, connections, homologies, functions and diseases.
Vogt BA. Vogt BA. J Chem Neuroanat. 2016 Jul;74:28-46. doi: 10.1016/j.jchemneu.2016.01.010. Epub 2016 Mar 15. J Chem Neuroanat. 2016. PMID: 26993424 Review. - Cingulate impairments in ADHD: Comorbidities, connections, and treatment.
Vogt BA. Vogt BA. Handb Clin Neurol. 2019;166:297-314. doi: 10.1016/B978-0-444-64196-0.00016-9. Handb Clin Neurol. 2019. PMID: 31731917 Review.
Cited by
- Highfield imaging of the subgenual anterior cingulate cortex in uni- and bipolar depression.
Buchholz F, Meffert M, Bazin PL, Trampel R, Turner R, Schönknecht P. Buchholz F, et al. Front Psychiatry. 2024 Oct 11;15:1462919. doi: 10.3389/fpsyt.2024.1462919. eCollection 2024. Front Psychiatry. 2024. PMID: 39465046 Free PMC article. - Neurodevelopmental and Neuropsychiatric Disorders.
Traetta ME, Chaves Filho AM, Akinluyi ET, Tremblay MÈ. Traetta ME, et al. Adv Neurobiol. 2024;37:457-495. doi: 10.1007/978-3-031-55529-9_26. Adv Neurobiol. 2024. PMID: 39207708 Review. - Coordination between midcingulate cortex and retrosplenial cortex in pain regulation.
Qiu Y, Lian YN, Wu C, Liu L, Zhang C, Li XY. Qiu Y, et al. Front Mol Neurosci. 2024 Aug 6;17:1405532. doi: 10.3389/fnmol.2024.1405532. eCollection 2024. Front Mol Neurosci. 2024. PMID: 39165718 Free PMC article. - Generative Modelling of Cortical Receptor Distributions from Cytoarchitectonic Images in the Macaque Brain.
Nebli A, Schiffer C, Niu M, Palomero-Gallagher N, Amunts K, Dickscheid T. Nebli A, et al. Neuroinformatics. 2024 Jul;22(3):389-402. doi: 10.1007/s12021-024-09673-7. Epub 2024 Jul 8. Neuroinformatics. 2024. PMID: 38976151 Free PMC article. - Measuring functional connectivity in frequency-domain helps to better characterize brain function.
Peng L, Su J, Hu D, Yu Y, Wei H, Li M. Peng L, et al. Hum Brain Mapp. 2024 Jul 15;45(10):e26726. doi: 10.1002/hbm.26726. Hum Brain Mapp. 2024. PMID: 38949487 Free PMC article.
References
- An X,Bandler R,Öngür D,Price JL ( 1998): Prefrontal cortical projections to longitudinal columns in the midbrain periaqueductal gray in macaque monkeys. J Comp Neurol 401: 544–479. - PubMed
- Botvinick MM,Cohen JD,Carter CS ( 2004): Conflict monitoring and anterior cingulate cortex: An update. Trends Cogn Sci 8: 539–546. - PubMed
- Bozkurt A,Zilles K,Schleicher A,Kamper L,Sanz Arigita E,Uylings HB,Kötter R ( 2005): Distributions of transmitter receptors in the macaque cingulate cortex. Neuroimage 25: 219–229. - PubMed
- Braak H ( 1976): A primitive gigantopyramidal field buried in the depth of the cingulate sulcus of the human brain. Brain Res 109: 219–233. - PubMed
- Broca P ( 1878): Anatomic comparée des circonvolutions cérébrales. Le grand lobe limbique et la scissure limbique dans la série des mammiféres. Rev Anthropol 1: 456–498.
Publication types
MeSH terms
Substances
LinkOut - more resources
Full Text Sources


