Defects in CTLA-4 are associated with abnormal regulatory T cell function in rheumatoid arthritis - PubMed (original) (raw)
Defects in CTLA-4 are associated with abnormal regulatory T cell function in rheumatoid arthritis
Fabian Flores-Borja et al. Proc Natl Acad Sci U S A. 2008.
Abstract
The ultimate goal for the treatment of autoimmunity is to restore immunological tolerance. Regulatory T cells (Treg) play a central role in immune tolerance, and Treg functional abnormalities have been identified in different autoimmune diseases, including rheumatoid arthritis (RA). We have previously shown that natural Treg from RA patients are competent at suppressing responder T cell proliferation but not cytokine production. Here, we explore the hypothesis that this Treg defect in RA is linked with abnormalities in the expression and function of CTLA-4. We demonstrate that CTLA-4 expression on Treg from RA patients was significantly reduced compared with healthy Treg and is associated with an increased rate of CTLA-4 internalization. Regulation of T cell receptor signaling by CTLA-4 was impaired in RA Treg and associated with delayed recruitment of CTLA-4 to the immunological synapse. Artificial induction of CTLA-4 expression on RA Treg restored their suppressive capacity. Furthermore, CTLA-4 blockade impaired healthy Treg suppression of T cell IFN-gamma production, but not proliferation, thereby recapitulating the unique Treg defect in RA. Our results suggest that defects in CTLA-4 could contribute to abnormal Treg function in RA and may represent a target for therapy for inducing long-lasting remission.
Conflict of interest statement
The authors declare no conflict of interest.
Figures
Fig. 1.
Foxp3 suppresses cytokine production in RA Treg. (A) Ex vivo PBMC from healthy controls and patients with active RA were stained for CD4, Foxp3, and IL-2 or IFN-γ. Representative FACS plots for IL-2 and IFN-γ production are shown. The bar graph shows the cumulative data of cytokine levels in healthy and RA Foxp3high (hi), low (lo), and negative (neg) cells (gated on CD4+ T cells). (B) Percentage of Foxp3hi and Foxp3lo CD4 T cells in healthy controls and patients with active RA is shown. *, P < 0.05
Fig. 2.
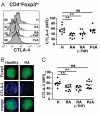
Reduced expression of CTLA-4 in Treg from RA patients. (A) PBMC were surface-stained for CD4 followed by intracellular staining for Foxp3 and CTLA-4. Representative histograms [mean fluorescence intensity (MFI) indicated] and cumulative data for CTLA-4 MFI in (ex vivo) CD4+Foxp3hi cells from healthy individuals, RA, anti-TNF-treated RA patients and PsA patients; 10 healthy controls and 10 patients in each disease group were studied. (B) Ex vivo CD4+ cells were fixed/permeabilized, stained for Foxp3 (green) and CTLA-4 (blue) and analyzed by confocal microscopy. Merged pictures show combined staining for Foxp3 and CTLA-4. Images are representative of at least 25 cells from 5 healthy controls and 5 patients with RA. (Magnification: 63×.) (C) Representative histograms and cumulative data for CTLA-4 MFI in ex vivo healthy, RA, and PsA Treg defined as CD4+CD25+CD127−; 10 healthy controls and 10 patients in each disease group were studied. *, P < 0.05; **, P < 0.01.
Fig. 3.
Increased internalization rates of CTLA-4 in RA Treg. (A) FACS-sorted Treg (CD4+CD25+CD127−) were treated with 10 ng/ml PMA to induce CTLA-4 accumulation at the cell membrane, stained for CTLA-4, and then incubated for 5 min to allow internalization of CTLA-4. Confocal microscopy analysis showed areas of CTLA-4 aggregation in healthy Treg (arrow) compared with a diffuse staining pattern in RA Treg. Pictures are representative of Treg-sorted samples derived from 4 healthy controls and 4 RA patients. (Magnification: 63×.) (B) CTLA-4 internalization after treatment with 10 ng/ml PMA for 1 h at 37 °C was determined by FACS and expressed as percentage of CTLA-4 internalization. Results represent the mean ± SE of 4 healthy controls and 6 patients with active RA. *, P < 0.05.
Fig. 4.
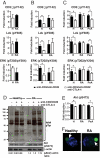
CTLA-4-mediated regulation of TCR-associated signaling is impaired in RA Treg. (A) FACS-sorted Tresp (CD4+CD25−CD127+) from healthy controls and RA patients were sorted and stimulated with anti-CD3 (1 μg/106 cells)/CD28 (1 μg/106 cells) antibodies for 10 min at 37 °C. Results represent the mean ± SE from 6 healthy individuals and 6 patients with RA. (B) FACS-sorted Treg (CD4+CD25+CD127−) were stimulated with anti-CD3 (1 μg/106 cells)/CD28 (1 μg/106 cells) ± anti-CTLA-4 (5 μg/106 cells) antibodies for 10 min. Phosphorylation of signaling molecules was evaluated by flow cytometry after intracellular staining with phosphospecific antibodies. Shown are percentage increases in protein tyrosine-phosphorylation (p) levels of TCR-associated signaling proteins in stimulated Treg. Results represent the mean ± SE from 6 healthy individuals and 6 patients with RA. (C) PBMC were stimulated as in B and the induction of phosphorylation was evaluated in the CD4+Foxp3hi subset. Results represent the mean ± SE from 6 healthy individuals, 6 patients with RA, and 6 patients with PsA. (D) Analysis of total protein-tyrosine phosphorylation in Treg from patients with RA and healthy controls. FACS-sorted Treg were stimulated for 10 min at 37 °C with anti-CD3 (1 μg/106 cells)/CD28 (1 μg/106 cells) ± anti-CTLA-4 (5 μg/106 cells). Samples from 3 different healthy individuals or 3 different RA patients (matched for disease activity score) were pooled before loading onto gels for protein phosphorylation analysis by Western blot. The lower gels show incubation of membranes with anti-S 473-Akt and anti-β-actin antibodies. Also indicated are the phospho Akt/β-actin ratios obtained from densitometry analysis. (E) Induction of phosphorylation of Akt in CD4+Foxp3hi T cells, PBMC stimulated as in B. Results represent the mean ± SE from 6 healthy individuals, 6 patients with RA, and 6 patients with PsA. (F) Purified Treg were mixed with beads coated with anti-CD3/CD28 antibodies. Activation was stopped at 10 min with 2% paraformaldehyde, and cells were stained for Foxp3 and CTLA-4. Recruitment of CTLA-4 (blue) to the immunological synapse (beads:Foxp3+ cell depicted) is indicated (arrow). Confocal microscopy images are representative of at least 25 conjugates from 4 healthy controls and 4 patients with RA. (Magnification: 63×.) *, P < 0.05.
Fig. 5.
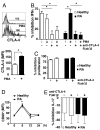
Restoration of suppressive capacity of RA Treg after induced delivery of CTLA-4 to the cell surface. (A) Histogram of surface CTLA-4 expression in isolated RA Treg before and after incubation with 10 ng/ml PMA for 1 h, and the cumulative data are indicated. MFI was calculated by using the indicated gate based on isotype control. Results represent the mean ± SE of 6 RA patients. (B) Cocultures of Treg (CD4+CD25+CD127−) with or without exposure to 10 ng/ml PMA for 1 h, and Tresp (CD4+CD25−CD127+) (1:2) from RA patients and healthy individuals were incubated in the presence of anti-CD3 (1 μg/ml)/CD28 (2 μg/ml) ± anti-CTLA-4 (10 μg/ml). After 3 days, cocultures were stained for IFN-γ, before analysis by FACS. Results represent the mean ± SE of 6 patients and 6 healthy controls and are expressed as the percentage inhibition of IFN-γ production compared with Tresp alone. (C) Cocultures of Treg and Tresp (1:2) were incubated in the presence of anti-CD3 (1 μg/ml)/CD28 (2 μg/ml) ± anti-CTLA-4 (10 μg/ml). Proliferation after 4 days was determined by 3[H]Tdr incorporation, and results are expressed as percentage inhibition of proliferation. Results represent the mean ± SE of 5 healthy controls and 5 patients with RA. (D) PBMC were stimulated with CD3 (1 μg/ml)/CD28 (2 μg/ml) antibodies for up to 24 h. The graphs show the time course for CD80 expression in Tresp. Results represent the mean ± SE of 5 healthy controls and 5 patients with RA. (E) Cocultures of Treg and Tresp (1:2) and Tresp alone were incubated as in B. Results represent the mean ± SE of 4 RA patients and 4 healthy controls and are expressed as the percentage inhibition of IL-17 production compared with Tresp alone. *, P < 0.05.
Similar articles
- Polyfunctional, Pathogenic CD161+ Th17 Lineage Cells Are Resistant to Regulatory T Cell-Mediated Suppression in the Context of Autoimmunity.
Basdeo SA, Moran B, Cluxton D, Canavan M, McCormick J, Connolly M, Orr C, Mills KH, Veale DJ, Fearon U, Fletcher JM. Basdeo SA, et al. J Immunol. 2015 Jul 15;195(2):528-40. doi: 10.4049/jimmunol.1402990. Epub 2015 Jun 10. J Immunol. 2015. PMID: 26062995 - Methotrexate Restores Regulatory T Cell Function Through Demethylation of the FoxP3 Upstream Enhancer in Patients With Rheumatoid Arthritis.
Cribbs AP, Kennedy A, Penn H, Amjadi P, Green P, Read JE, Brennan F, Gregory B, Williams RO. Cribbs AP, et al. Arthritis Rheumatol. 2015 May;67(5):1182-92. doi: 10.1002/art.39031. Arthritis Rheumatol. 2015. PMID: 25604080 - Regulatory T cells in rheumatoid arthritis showed increased plasticity toward Th17 but retained suppressive function in peripheral blood.
Wang T, Sun X, Zhao J, Zhang J, Zhu H, Li C, Gao N, Jia Y, Xu D, Huang FP, Li N, Lu L, Li ZG. Wang T, et al. Ann Rheum Dis. 2015 Jun;74(6):1293-301. doi: 10.1136/annrheumdis-2013-204228. Epub 2014 Feb 12. Ann Rheum Dis. 2015. PMID: 24521740 - Regulatory T cells in Arthritis.
Komatsu N, Takayanagi H. Komatsu N, et al. Prog Mol Biol Transl Sci. 2015;136:207-15. doi: 10.1016/bs.pmbts.2015.07.021. Epub 2015 Aug 28. Prog Mol Biol Transl Sci. 2015. PMID: 26615098 Review. - T-cell regulatory mechanisms in specific immunotherapy.
Jutel M, Akdis C. Jutel M, et al. Chem Immunol Allergy. 2008;94:158-177. doi: 10.1159/000155000. Chem Immunol Allergy. 2008. PMID: 18802346 Review.
Cited by
- Antigen-specific transforming growth factor β-induced Treg cells, but not natural Treg cells, ameliorate autoimmune arthritis in mice by shifting the Th17/Treg cell balance from Th17 predominance to Treg cell predominance.
Kong N, Lan Q, Chen M, Wang J, Shi W, Horwitz DA, Quesniaux V, Ryffel B, Liu Z, Brand D, Zou H, Zheng SG. Kong N, et al. Arthritis Rheum. 2012 Aug;64(8):2548-58. doi: 10.1002/art.34513. Arthritis Rheum. 2012. PMID: 22605463 Free PMC article. - T cells out of control--impaired immune regulation in the inflamed joint.
Wehrens EJ, Prakken BJ, van Wijk F. Wehrens EJ, et al. Nat Rev Rheumatol. 2013 Jan;9(1):34-42. doi: 10.1038/nrrheum.2012.149. Nat Rev Rheumatol. 2013. PMID: 23390638 Review. - The yin and yang of regulatory T cells and inflammation in RA.
Notley CA, Ehrenstein MR. Notley CA, et al. Nat Rev Rheumatol. 2010 Oct;6(10):572-7. doi: 10.1038/nrrheum.2010.143. Epub 2010 Aug 31. Nat Rev Rheumatol. 2010. PMID: 20808295 Review. - DMGV Is a Rheostat of T Cell Survival and a Potential Therapeutic for Inflammatory Diseases and Cancers.
Yang FM, Shen L, Fan DD, Chen KH, Lee J. Yang FM, et al. Front Immunol. 2022 Aug 5;13:918241. doi: 10.3389/fimmu.2022.918241. eCollection 2022. Front Immunol. 2022. PMID: 35990633 Free PMC article. - Impact of Posttranslational Modification in Pathogenesis of Rheumatoid Arthritis: Focusing on Citrullination, Carbamylation, and Acetylation.
Kwon EJ, Ju JH. Kwon EJ, et al. Int J Mol Sci. 2021 Sep 30;22(19):10576. doi: 10.3390/ijms221910576. Int J Mol Sci. 2021. PMID: 34638916 Free PMC article. Review.
References
- Sansom DM, Walker LSK. The role of CD28 and cytotoxic T lymphocyte antigen-4 (CTLA-4) in regulatory T cell biology. Immunol Rev. 2006;212:131–148. - PubMed
Publication types
MeSH terms
Substances
Grants and funding
- 17707/ARC_/Arthritis Research UK/United Kingdom
- 17707/VAC_/Versus Arthritis/United Kingdom
- 16309/ARC_/Arthritis Research UK/United Kingdom
- 17319/ARC_/Arthritis Research UK/United Kingdom
- 17746/ARC_/Arthritis Research UK/United Kingdom
- 18106/VAC_/Versus Arthritis/United Kingdom
- 18106/ARC_/Arthritis Research UK/United Kingdom
LinkOut - more resources
Full Text Sources
Medical


