Distinct stages of myelination regulated by gamma-secretase and astrocytes in a rapidly myelinating CNS coculture system - PubMed (original) (raw)
Distinct stages of myelination regulated by gamma-secretase and astrocytes in a rapidly myelinating CNS coculture system
Trent A Watkins et al. Neuron. 2008.
Abstract
Mechanistic studies of CNS myelination have been hindered by the lack of a rapidly myelinating culture system. Here, we describe a versatile CNS coculture method that allows time-lapse microscopy and molecular analysis of distinct stages of myelination. Employing a culture architecture of reaggregated neurons fosters extension of dense beds of axons from purified retinal ganglion cells. Seeding of oligodendrocyte precursor cells on these axons results in differentiation and ensheathment in as few as 3 days, with generation of compact myelin within 6 days. This technique enabled (1) the demonstration that oligodendrocytes initiate new myelin segments only during a brief window early in their differentiation, (2) identification of a contribution of astrocytes to the rate of myelin wrapping, and (3) molecular dissection of the role of oligodendrocyte gamma-secretase activity in controlling the ensheathment of axons. These insights illustrate the value of this defined system for investigating multiple aspects of CNS myelination.
Figures
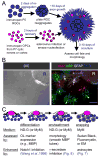
Figure 1. Schematic of myelinating cocultures of OPCs with RGC reaggregates
(A) Perinatal (P5) RGCs are purified by immunopanning and allowed to reaggregate for 2 days on a poorly-adhesive surface prior to plating on a substrate permissive for axon growth for 7–14 days. OPCs are then acutely isolated from optic nerves or cortices and, when transfection is necessary, recovered for a couple of hours to enable recombinant adenovirus infection or amaxa nucleofection. Transfer of these OPCs to the reaggregate cultures initiates the coculture that results in myelination, analyzed by immunostaining after six days. (B) A coculture six days after seeding of optic nerve OPCs analyzed for cell fate and morphology by differential-interference contrast (DIC) microscopy and indirect immunofluorescence. Examples of OPCs (NG2, red), non-myelinating OLs (MBP, green), and astrocytes (GFAP, white) are indicated by arrows of the corresponding colors. Myelinating OLs (green arrowheads) are identified by their extension of multiple distinctive smooth tubes. Nuclei are counterstained with DAPI (blue). An RGC reaggregate is denoted by “R”. Scale bar = 100 μm. (C) A schematic of the development of a myelinating OL in three stages. A bipolar OPC differentiates into an immature OL that begins to express myelin proteins and extends multiple processes amongst the RGC axons. These OL processes ensheathe axons, depositing one smooth layer of membrane. The final stage consists of the wrapping of multiple layers of membrane and the extrusion of cytoplasm to form compact myelin.
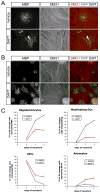
Figure 2. Treatment of cocultures with a γ-secretase inhibitor disinhibits OL differentiation and myelination
(A) Immunostaining of 3-day cocultures of optic nerve OPCs and RGC reaggregates treated with a γ-secretase inhibitor (1 μM DAPT) or vehicle (DMSO) in ND-G medium. Early myelinating OLs (arrowhead) are observed after three days in the presence of DAPT. Scale bar = 50 μm. (B) Immunostaining of 4-day DAPT-treated cocultures reveals substantial OL differentiation and myelination. Scale bar = 100 μm. (C) Time-course of optic nerve OPC cell fates on RGC reaggregates in the presence (DAPT) or absence (DMSO) of a γ-secretase inhibitor (n = 3 cocultures per condition).
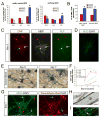
Figure 3. Myelination in cocultures of cortical OPCs and RGC reaggregates
(A) The disinhibition of differentiation upon γ-secretase inhibition (1 μM DAPT) is less pronounced in RGC cocultures with cortical OPCs than in those with optic nerve OPCs after 6 days in ND-G (unpaired _t_-test, *p<0.05, n = 3 cocultures per condition). Optic nerve OPC graph is replotted from day 6 data of Figure 3C. DMSO is the vehicle-only control. (B) The proportion of MBP-expressing OLs forming myelin segments is equivalently enhanced by treatment with DAPT in both optic nerve and cortical OPC cocultures (unpaired _t_-test, *p<0.005, n = 3 per condition). (C) Triple labeling of cocultures grown for three days in MyM containing DAPT (1 μM) reveals OLs in multiple stages of development. CNP+ MBP− PLP− newly formed OLs (red arrows), CNP+ MBP+ PLP− immature OLs (white arrow), and CNP+ MBP+ PLP+ myelinating OLs (green arrow) are observed at this stage. Scale bar = 50 μm. (D) α-MOG immunostaining demonstrates isolated mature, ensheathing OLs on the third day of coculture. Scale bar = 50 μm. (E) Sudan Black staining of cocultures reveals thin compact myelin by day 5 with more advanced wrapping by day 7. Examples of Sudan Black-labeled myelin segments are indicated (blue arrows). Scale bar = 25 μm. (F) Time course of myelin markers in cocultures of rat cortical OPCs and rat RGCs over 7 days in MyM with DAPT, including sequential protein markers of OL maturation (CNP, MBP, PLP, and MOG) and a lipophilic dye reporting the degree of wrapping (Sudan Black). Numbers of cells displaying each marker was assessed over ten fields. (G) Dual-labeling for OL maturation and ensheathment with α-MOG and for compact myelin formation with the lipophilic dye FluoroMyelin-Red. Note that there are both myelinated segments (red arrows) and ensheathing or aligning OL processes that have not generated enough wraps to be detected above background (green arrows). Cell nuclei are counter-stained with DAPI. Scale bar = 25 μm. (H) Electron micrograph of a myelinated axon in a coculture of RGCs with cortical OPCs maintained for 7 days in MyM containing DAPT. The axon is indicated by the blue “a” and compact myelin by the blue “m”. Scale bar = 0.5 μm. (I) A node of Ranvier (arrowhead) in a 12-day DAPT-treated coculture in ND-G. A cluster of sodium channels (NaCh, blue) is flanked by clusters of a paranodal protein (Caspr, red) between the ends of two myelin sheaths (MBP, green). Scale bar = 10 μm.
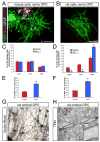
Figure 4. Myelinating cocultures with mouse RGCs
(A) Cocultures of mouse RGCs with mouse optic nerve OPC at day 6 in ND-G with DAPT (1 μM) contain OPCs (red arrow), astrocytes (white arrow), non-myelinating OLs (green arrow), and myelinating OLs (green arrowhead). Scale bar = 50 μm. (B) An OL ensheathing RGC axons (MBP, green) in a coculture of rat optic nerve OPCs with mouse RGCs at day 6 in ND-G containing DAPT. Scale bar = 50 μm. (C) Coculture of mouse optic nerve OPCs with mouse RGCs results in significant inhibition of OL differentiation, even in the presence of DAPT (n = 4 cocultures per condition). (D) Inhibition of γ-secretase promotes nearly complete OL differentiation in cocultures of rat optic nerve OPCs with mouse RGCs (unpaired _t_-test, *p<0.005, n = 6 cocultures per condition). (E) Inhibition of γ-secretase with DAPT increases the proportion of mouse optic nerve OLs ensheathing mouse RGC axons (unpaired _t_-test, *p<0.05, n = 4 cocultures per condition). (F) Inhibition of γ-secretase with DAPT increases the proportion of rat optic nerve OLs ensheathing mouse RGC axons (unpaired _t_-test, *p<0.005, n = 6 cocultures per condition). (G) A DAPT-treated coculture of mouse RGCs and rat cortical OPCs stained for compact myelin with Sudan Black after 11 days of coculture (switched to MyM on day 5). Scale bar = 50 μm. (H) An electron micrograph of a companion coculture to the one seen in (G) shows multiple myelinated axons. Scale bar = 2 μm. The blue dashed box indicates the region shown at higher magnification in the inset. Inset scale bar = 0.4 μm.
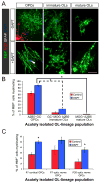
Figure 5. Oligodendrocytes rapidly lose the capacity to myelinate as they progress through the lineage
(A) Immunostaining of cocultures of RGCs with OPCs, immature OLs, or mature OLs that were acutely purified in parallel from P13 rat optic nerves. Cocultures were maintained in ND-G for six days in presence or absence of a γ-secretase inhibitor (1 μM DAPT). Smooth myelin sheaths are extended by an OL that was newly generated from an OPC in the presence of DAPT (arrowhead), but the various morphologies of acutely isolated OLs rarely include distinct tubes of myelin around RGC axons. Scale bar = 50 μm. (B) OPC-depleted (A2B5−) populations of GC+ and MOG+ OLs from P13 rat optic nerves are limited in their ability to myelinate RGC axons (one-way ANOVA, p<0.0001, post-hoc Tukey-Kramer tests, *p<0.001, n = 4 per condition). (C) Adult OPCs isolated from P30 rat optic nerves retain nearly the same capacity to develop into myelinating OLs as perinatal (P7) cortical or optic nerve OPCs (one-way ANOVA, p<0.0001, post-hoc Tukey-Kramer tests, *p<0.05, n = 6–7 per condition).
Figure 6. Time-lapse microscopy reveals a brief window for myelination in the maturation of oligodendrocytes
(A) Time-lapse of a developing OL expressing membrane-targeted EGFP-F as it initiated multiple myelin segments (example indicated by arrowhead) over a brief period (6h–18h), beginning during its sixth day in vitro (6 DIV) with RGC reaggregates in ND-G containing DAPT (1 μM). Following this period, no new clear, stable segments were established (18h–30h). Scale bar = 50 μm. (B) Dual-color time-lapse of a developing OL expressing EGFP-F (green) under the control of the CMV promoter and mCherry-F (red) under the control of the MBP promoter (MBPp), beginning on the third day (3 d) of coculture in ND-G with DAPT. Multiple new myelin segments were initiated as mCherry-F expression increased, but days 5–6 were marked only by extension (arrowhead), retraction (arrow), and stabilization of existing segments, without formation of new ones. Scale bar = 50 μm. (C) Dual-transfected OPCs were evaluated for the initiation of new myelin segments and their expression of mCherry-F over 3–4 days. Mature OLs that began with near-maximal expression of mCherry-F rarely initiated new myelin segments, whereas newly differentiated OLs that clearly increased mCherry-F intensity frequently myelinated (% of cells forming at least one new clear myelin segment ± standard error of the proportion, *p<0.01, _z_-test for independent proportions, n = 52 cells that began with low or sub-maximal mCherry-F expression and 47 cells that began with near-maximal mCherry-F expression).
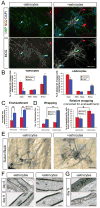
Figure 7. Optic nerve astrocytes enhance the rate and degree of myelin wrapping in RGC-optic nerve OPC cocultures
(A) Cocultures of rat RGCs and rat optic nerve OPCs with or without rat optic nerve astrocytes maintained for six days in MyM in the absence of DAPT. OPCs (NG2, red arrow), non-myelinating OLs (MBP, green arrow), and myelinating OLs (MBP, green arrowhead) can be detected by immunostaining. Scale bar = 50 μm. (B) γ-Secretase inhibition (1 μM DAPT) increases differentiation of OLs from NG2+ OPCs to MOG+ OLs over six days of coculture in the presence or absence of optic nerve astrocytes (unpaired _t_-test, *p<0.005, n = 4 cocultures per condition). (C) γ-Secretase inhibition (DAPT) promotes ensheathment of axons in the presence or absence of astrocytes, as assessed morphologically by the formation of two or more smooth tubes immunostained for MOG (one-way ANOVA, p<0.005, post-hoc Tukey-Kramer tests, *p<0.05, n = 4 per condition). (D) Optic nerve astrocytes increase myelin thickness in cocultures, as determined by the total number of OLs forming Sudan Black-labeled myelin segments over ten 40x fields. A value corrected for the different number of OLs in each condition (Relative wrapping) was calculated by dividing this Sudan Black total by the average number of MOG+ ensheathing OLs over the same area determined in companion cultures (one-way ANOVA, p<0.05, post-hoc Tukey-Kramer tests, *p<0.05, n = 3 per condition). (E) Myelin wrapping is more advanced in cocultures containing optic nerve astrocytes, maintained for 6 days in MyM without DAPT, as seen by labeling with the lipophilic dye Sudan Black B. Scale bar = 25 μm. (F) Electron micrographs of 6- and 9-day cocultures of rat RGCs and rat optic nerve OPCs maintained in MyM with DAPT. Cocultures with added optic nerve astrocytes show more rapid and extensive wrapping of axons. Scale bar = 0.5 μm. (G) High-magnification electron micrographs of cocultures grown for 9 days in MyM with DAPT demonstrate that generation of thick myelin (top image) and mature paranodal loops (bottom image) occur even in the absence of added astrocytes over these longer culture periods. Scale bars = 0.2 μm (top) and 0.5 μm (bottom).
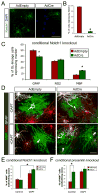
Figure 8. γ-Secretase inhibition promotes ensheathment of RGC axons independently of Notch1
(A) Cre-mediated knockout of glial Notch1 in cocultures. Acutely purified cortical OPCs from Notch1 conditional knockout mice were infected with a control replication-defective adenovirus (AdEmpty) or a recombinant adenovirus encoding Cre recombinase (AdCre) and cocultured for three days with rat RGC reaggregates prior to α-Notch1 immunostaining (green). Cell nuclei were counterstained with DAPI (blue). Scale bar = 50 μm. (B) Quantification of AdCre-mediated Notch1 knockout at day 3 (percentage of live OL-lineage cells expressing Notch1 ± standard error of the proportion, *p<0.01, _z_-test for independent proportions, n = 186 cells for AdEmpty and 243 cells for AdCre). (C) AdCre-mediated knockout of Notch1 increases OL differentiation over seven days in cocultures in ND-G (unpaired _t_-test, *p<0.005, n = 5 per condition). (D) Non-myelinating (arrows) and myelinating (arrowheads) OLs (green) in 7-day cocultures of RGCs with Notch1 conditional knockout OPCs. Immediately prior to seeding on RGC axons, acutely purified OPCs were infected for 2 hours with AdEmpty or AdCre. DAPT (1 μM) was added to the ND-G on the third day of coculture. Scale bar = 50 μm. (E) Addition of DAPT on the third day of coculture increases the proportion of OLs that form distinct myelin segments rather than sheets of MBP+ membrane over seven days, independently of the presence (AdEmpty) or absence (AdCre) of Notch1 (one-way ANOVA, p<0.005, post-hoc Tukey-Kramer test, *p<0.01, n = 5 per condition). (F) AdCre-mediated disruption of γ-secretase in presenilin-2-deficient, presenilin-1 conditional knockout OPCs promotes ensheathment of RGC axons equivalently to adding DAPT on the third day of coculture in ND-G (one-way ANOVA, p<0.005, post-hoc Tukey-Kramer tests, *p<0.05, n = 5–6 per condition).
Similar articles
- Oligodendrocyte-spinal cord explant co-culture: an in vitro model for the study of myelination.
Chen Z, Ma Z, Wang Y, Li Y, Lü H, Fu S, Hang Q, Lu PH. Chen Z, et al. Brain Res. 2010 Jan 14;1309:9-18. doi: 10.1016/j.brainres.2009.10.060. Epub 2009 Oct 30. Brain Res. 2010. PMID: 19879858 - N-cadherin is involved in axon-oligodendrocyte contact and myelination.
Schnädelbach O, Ozen I, Blaschuk OW, Meyer RL, Fawcett JW. Schnädelbach O, et al. Mol Cell Neurosci. 2001 Jun;17(6):1084-93. doi: 10.1006/mcne.2001.0961. Mol Cell Neurosci. 2001. PMID: 11414796 - LINGO-1 negatively regulates myelination by oligodendrocytes.
Mi S, Miller RH, Lee X, Scott ML, Shulag-Morskaya S, Shao Z, Chang J, Thill G, Levesque M, Zhang M, Hession C, Sah D, Trapp B, He Z, Jung V, McCoy JM, Pepinsky RB. Mi S, et al. Nat Neurosci. 2005 Jun;8(6):745-51. doi: 10.1038/nn1460. Epub 2005 May 15. Nat Neurosci. 2005. PMID: 15895088 - Isolation and long-term expansion of functional, myelinating oligodendrocyte progenitor cells from neonatal rat brain.
Zhu B, Zhao C, Young FI, Franklin RJ, Song B. Zhu B, et al. Curr Protoc Stem Cell Biol. 2014 Nov 3;31:2D.17.1-15. doi: 10.1002/9780470151808.sc02d17s31. Curr Protoc Stem Cell Biol. 2014. PMID: 25366898 Review. - Schwann cell remyelination of the central nervous system: why does it happen and what are the benefits?
Chen CZ, Neumann B, Förster S, Franklin RJM. Chen CZ, et al. Open Biol. 2021 Jan;11(1):200352. doi: 10.1098/rsob.200352. Epub 2021 Jan 27. Open Biol. 2021. PMID: 33497588 Free PMC article. Review.
Cited by
- In vitro myelin formation using embryonic stem cells.
Kerman BE, Kim HJ, Padmanabhan K, Mei A, Georges S, Joens MS, Fitzpatrick JA, Jappelli R, Chandross KJ, August P, Gage FH. Kerman BE, et al. Development. 2015 Jun 15;142(12):2213-25. doi: 10.1242/dev.116517. Epub 2015 May 26. Development. 2015. PMID: 26015546 Free PMC article. - Leukodystrophy caused by plasmalogen deficiency rescued by glyceryl 1-myristyl ether treatment.
Malheiro AR, Correia B, Ferreira da Silva T, Bessa-Neto D, Van Veldhoven PP, Brites P. Malheiro AR, et al. Brain Pathol. 2019 Sep;29(5):622-639. doi: 10.1111/bpa.12710. Epub 2019 Feb 20. Brain Pathol. 2019. PMID: 30667116 Free PMC article. - MicroRNAs in oligodendrocyte and Schwann cell differentiation.
Dugas JC, Notterpek L. Dugas JC, et al. Dev Neurosci. 2011;33(1):14-20. doi: 10.1159/000323919. Epub 2011 Feb 23. Dev Neurosci. 2011. PMID: 21346322 Free PMC article. Review. - Astrocytes are an early target in osmotic demyelination syndrome.
Gankam Kengne F, Nicaise C, Soupart A, Boom A, Schiettecatte J, Pochet R, Brion JP, Decaux G. Gankam Kengne F, et al. J Am Soc Nephrol. 2011 Oct;22(10):1834-45. doi: 10.1681/ASN.2010111127. Epub 2011 Sep 1. J Am Soc Nephrol. 2011. PMID: 21885671 Free PMC article. - Non-cell-autonomous factor induces the transition from excitatory to inhibitory GABA signaling in retina independent of activity.
Barkis WB, Ford KJ, Feller MB. Barkis WB, et al. Proc Natl Acad Sci U S A. 2010 Dec 21;107(51):22302-7. doi: 10.1073/pnas.1008775108. Epub 2010 Dec 6. Proc Natl Acad Sci U S A. 2010. PMID: 21135238 Free PMC article.
References
- Barres BA, Lazar MA, Raff MC. A novel role for thyroid hormone, glucocorticoids and retinoic acid in timing oligodendrocyte development. Development. 1994;120:1097–1108. - PubMed
- Bunge RP. Tissue culture observations relevant to the study of axon-Schwann cell interactions during peripheral nerve development and repair. J Exp Biol. 1987;132:21–34. - PubMed
- Cahoy JD, Emery B, Kaushal A, Foo LC, Zamanian JL, Christopherson KS, Xing Y, Lubischer JL, Krieg P, Krupenko SA, et al. A Transcriptome Database for Astrocytes, Neurons, and Oligodendrocytes: A New Resource for Understanding Brain Development and Function. J Neurosci. 2007;28:264–278. - PMC - PubMed
- Crang AJ, Gilson J, Blakemore WF. The demonstration by transplantation of the very restricted remyelinating potential of post-mitotic oligodendrocytes. J Neurocytol. 1998;27:541–553. - PubMed
Publication types
MeSH terms
Substances
LinkOut - more resources
Full Text Sources
Other Literature Sources
