Motor deficit in a Drosophila model of mucolipidosis type IV due to defective clearance of apoptotic cells - PubMed (original) (raw)
Motor deficit in a Drosophila model of mucolipidosis type IV due to defective clearance of apoptotic cells
Kartik Venkatachalam et al. Cell. 2008.
Abstract
Disruption of the Transient Receptor Potential (TRP) mucolipin 1 (TRPML1) channel results in the neurodegenerative disorder mucolipidosis type IV (MLIV), a lysosomal storage disease with severe motor impairments. The mechanisms underlying MLIV are poorly understood and there is no treatment. Here, we report a Drosophila MLIV model, which recapitulates the key disease features, including abnormal intracellular accumulation of macromolecules, motor defects, and neurodegeneration. The basis for the buildup of macromolecules was defective autophagy, which resulted in oxidative stress and impaired synaptic transmission. Late-apoptotic cells accumulated in trpml mutant brains, suggesting diminished cell clearance. The accumulation of late-apoptotic cells and motor deficits were suppressed by expression of trpml(+) in neurons, glia, or hematopoietic cells. We conclude that the neurodegeneration and motor defects result primarily from decreased clearance of apoptotic cells. Since hematopoietic cells in humans are involved in clearance of apoptotic cells, our results raise the possibility that bone marrow transplantation may limit the progression of MLIV.
Conflict of interest statement
The authors declare no conflicts of interest.
Figures
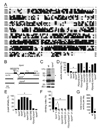
FIGURE 1. TRPML is required for normal viability and motor activity
(A) Alignment of Drosophila and human TRPML proteins. Lines indicate TMDs. (B) trpml genomic locus. The deletions in trpml1 and trpml2 are shown. (C) Western blot of extracts from wild-type (wt) and trpml1 flies probed with anti-TRPML antibodies and reprobed with anti-Rh1 antibodies (see Supplemental Experimental Procedures). The ~75 kDa band (arrowhead) corresponds to TRPML. The lower bands were due to non-specific interactions with anti-TRPML. (D) Percentage of pharate adults without the TM3 balancer after inter se crosses. n≥4 vials of each genotype; *, p≤5×10⁻⁶, ANOVA. Df1, Df(3L)ED228; Df2, Df(3L)Exel6135; trpml1/2, trpml1/trpml2; P[_trpml_], genomic rescue; trpmlrev, precise excision. (E) Percentage of dead pupae. n=4 vials; *, p≤0.005, ANOVA. (F) Climbing indices. Percentages of flies in a 50 ml glass cylinder that climb to the 25 ml mark in 15 s after being tapped down. n≥13, 10–20 flies each; *, p≤×10−12, ANOVA; ¶, p≤5×10⁻⁴, t-test. (G) Number of crossings of an infra-red beam (24 h period) in an actometer. n=3, 13–14 individual 5 day-old flies each; *, p≤5×10⁻¹¹, t-test.
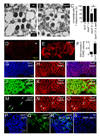
FIGURE 2. Neurodegeneration in trpml retina and brain
(A and B) Transmission EMs of photoreceptor cells (21 day-old flies): (A) wt, and (B) trpml1. (C) Percentages of ommatidia with full set of 7 rhabdomeres. n≥3 animals, ≥30 ommatidia per animal; *, difference from wt, p≤0.01, ANOVA; ¶, p≤0.05, t-test. (D and E) Confocal images of TUNEL-labeled brains (21 day-old flies): (D) wt, and (E) trpml1. (F) Fold increase in TUNEL labeling in trpml1 normalized to wt mean. n=3; *, p≤5×10⁻⁴, t-test. (G–I) Confocal images of brains from 21 day-old trpml1 viewed at 310 nm to detect DAPI (G) and 568 nm to detect TUNEL (H). (I) Merge. (J–L) Same as (G–I) but brains viewed at 633 nm to detect ELAV (J). (M–O) Same as (G–I) but brains viewed at 488 nm to detect REPO (M). Arrows indicate glia. (P–R) Confocal images of 21 day-old trpml1 brains viewed at 310 nm to detect DAPI (P) and 488 nm to detect Annexin V-FITC (Q). (R) Merge. (S) Same as (R) but with 21 day-old wt brains.
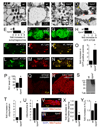
FIGURE 3. Disruption of autophagy in neural tissues in trpml
(A–D) Transmission EMs of 21 day-old photoreceptor cells: (A and B) wt, (C and D) trpml1. (B and D) Magnifications of the boxed regions in (A and C). The red and yellow arrows in (D) indicate multilamellar and multivesicular bodies respectively. (E) Fold-increase in autophagosome-like vesicles in trpml1 photoreceptors. n=5 animals, ≥30 ommatidia per animal; *, p≤10−4. (F and G) Brains (21 day-old flies) expressing GFP-ATG8 and viewed at 488 nm: (F) wt, (G) trpml1. (H) Fold-increase in GFP-ATG8 fluorescence in trpml1 brains. n=3; *, p≤5×10⁻⁴. (I–N) Ommatidia from 21 day-old flies expressing GFP-ATG8: (I–K) control, (L–N) trpml1. Ommatidia were viewed at 488 nm to detect GFP-ATG8 (I–L) and 568 nm to detect LysoTracker (Lyso; J–M). (K and N) Merges. (O) Fold-increase in GFP-positive vesicles in trpml1 ommatidia. n=3 independent experiments; *, p≤5×10⁻⁵. (P) Rh1 remaining after 6 h exposure to blue light (480 nm) in 5 day-old flies. Means are relative to the starting value (defined as 100%). n=3; *, p≤0.05. (Q and R) 4 week-old brains stained with anti-ubiquitin antibodies (Supplemental Experimental Procedures): (Q) wt, (R) trpml1. (S) Western blot of head extracts (4 week-old flies) probed with anti-ubiquitin antibodies and reprobed with anti-Tubulin antibodies. (T) Fold increase of ubiquitination in head extracts based on Western blotting. Data were normalized to wt (1.0). n=3; *, p ≤0.05. (U) Mitochondria per photoreceptor cell in 21 day-old wt flies. n=5 animals; *, p≤0.05. (V and W) Ommatidia from 21 day-old wt (V) and trpml1 (W) flies viewed at 310 nm to detect DAPI (blue) and 568 nm to detect MitoTracker-orange CM-H2TMRos (red). (X) Fold decrease in MitoTracker-orange CM-H2TMRos staining in trpml1 head extracts, normalized to wt (set at 1.0). n=3; *, p≤5×10⁻⁶. (Y) Relative H2O2 levels in whole fly extracts. Data were normalized to wt (set at 1.0). n≥6, 10 flies/experiment; *, p≤5×10⁻⁶. Dissected brains and ommatidia were viewed by confocal microscopy. All statistical analyses, t-test.
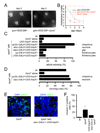
FIGURE 4. Toxic aggregation of macromolecules in trpml
(A) Ommatidia viewed by the optical neutralization technique ≤24 h post-eclosion. (B) Time course of photoreceptor degeneration viewed by optical neutralization. n≥3 flies, ≥50 ommatidia/fly; *, difference at each time point, p≥0.05. (C) Percentage of pharate adults without the TM3 balancer in wt, trpml1 and trpml1 with the indicated transgenes, n=7–11. GAL4 expression is indicated (fb, fat bodies). (D) Climbing indices. n=3–8, 10–20 flies each. (E) Merged confocal images of brains from 21 day-old flies viewed at 310 nm to detect DAPI and 488 nm to detect Annexin V-FITC. (F) Percentages of adult brain cells labeled with Annexin V-FITC. n≥3 brains; *, difference from wt, p≤0.05. All statistical analyses, t-test.
FIGURE 5. Impairment of synaptic transmission in the trpml
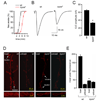
(A) Time-course of flies with restored mobility following a 3 min exposure to CO2. n=3, 10 flies per experiment. (B) Excitatory junctional current (EJC) from the 3rd instar NMJ. (C) Quantification of the EJC amplitudes in wt and trpml1. n=5 animals; 10 NMJs for each genotype; *, p≤0.001. (D) NMJ synapses following FM1-43 loading and unloading. Arrows indicate synaptic boutons. Panels below show enlarged magnification of synaptic boutons. (E) Quantification of FM1-43 fluorescence intensity in NMJ boutons following dye loading and unloading. n=5 animals,10 NMJs for each genotype; *, difference from wt, p≤0.001. All statistical analyses, t-test.
FIGURE 6. TRPML expression in either hemocytes/fat bodies or glia rescues the trpml pupal semi-lethality, locomotor defects and synaptic transmission impairment
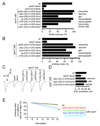
(A) Percentage of pharate adults without the TM3 balancer. n=7–11. GAL4 expression patterns are indicated. (B) Climbing indices of adult flies. n=3–8 experiments, 10–20 flies each. (C) Representative EJC traces of larvae. (D) Quantification of the EJC amplitudes. n=5 animals, 10 NMJs for each genotype; *, p≤10−4, ANOVA. hem, hemocytes. (E) Age-progressive decline in climbing index of wt (black) and trpml1 flies expressing UAS-trpml and the indicated _GAL4_s. Indices are normalized with 5 day values as 100%. n≥3, 10–20 flies per experiment; *, difference from wt, p≤0.05, ANOVA.
FIGURE 7. Reduced clearance of late-apoptotic cells in trpml mutants Images are by confocal microscopy
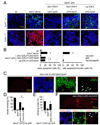
(A) DAPI/Annexin V-FITC and DAPI/PI stained brains from 21 day-old flies. (B) Percentage of early apoptotic and late apoptotic/necrotic cells in brains from 21 day-old flies. n≥3; *, difference from wt, p≤0.01, ANOVA. (C) Brains from 21 day-old flies viewed at 310 nm to detect DAPI, 488 nm to detect anti-REPO, 568 nm to detect TUNEL and 633 nm to detect anti-ELAV. Arrows indicate glia. (D) Percentage of pharate adults without the TM3 balancer. n=3–11; *, difference from trpml1, p≤0.05, ANOVA. (E) Climbing indices of adult flies. n≥5; *, difference from trpml1, p≤5×10⁻⁵, t-test. (F) Brains from 21 day-old flies viewed at 310 nm to detect DAPI, 488 nm to detect anti-REPO, 568 nm to detect TUNEL and 633 nm to detect ELAV. Arrows indicate glia.
Similar articles
- Chaperone-mediated autophagy is defective in mucolipidosis type IV.
Venugopal B, Mesires NT, Kennedy JC, Curcio-Morelli C, Laplante JM, Dice JF, Slaugenhaupt SA. Venugopal B, et al. J Cell Physiol. 2009 May;219(2):344-53. doi: 10.1002/jcp.21676. J Cell Physiol. 2009. PMID: 19117012 - Suppression of the motor deficit in a mucolipidosis type IV mouse model by bone marrow transplantation.
Walker MT, Montell C. Walker MT, et al. Hum Mol Genet. 2016 Jul 1;25(13):2752-2761. doi: 10.1093/hmg/ddw132. Epub 2016 Jun 7. Hum Mol Genet. 2016. PMID: 27270598 Free PMC article. - Mucolipidosis type IV and the mucolipins.
Bach G, Zeevi DA, Frumkin A, Kogot-Levin A. Bach G, et al. Biochem Soc Trans. 2010 Dec;38(6):1432-5. doi: 10.1042/BST0381432. Biochem Soc Trans. 2010. PMID: 21118102 - Mucolipin 1: endocytosis and cation channel--a review.
Bach G. Bach G. Pflugers Arch. 2005 Oct;451(1):313-7. doi: 10.1007/s00424-004-1361-7. Epub 2004 Nov 27. Pflugers Arch. 2005. PMID: 15570434 Review. - TRPML1: The Ca(2+)retaker of the lysosome.
Di Paola S, Scotto-Rosato A, Medina DL. Di Paola S, et al. Cell Calcium. 2018 Jan;69:112-121. doi: 10.1016/j.ceca.2017.06.006. Epub 2017 Jun 24. Cell Calcium. 2018. PMID: 28689729 Review.
Cited by
- Zinc: Multidimensional Effects on Living Organisms.
Cuajungco MP, Ramirez MS, Tolmasky ME. Cuajungco MP, et al. Biomedicines. 2021 Feb 22;9(2):208. doi: 10.3390/biomedicines9020208. Biomedicines. 2021. PMID: 33671781 Free PMC article. Review. - Regulation of lysosomal ion homeostasis by channels and transporters.
Xiong J, Zhu MX. Xiong J, et al. Sci China Life Sci. 2016 Aug;59(8):777-91. doi: 10.1007/s11427-016-5090-x. Epub 2016 Jul 19. Sci China Life Sci. 2016. PMID: 27430889 Free PMC article. Review. - Drosophila as a Model to Study Brain Innate Immunity in Health and Disease.
Lye SH, Chtarbanova S. Lye SH, et al. Int J Mol Sci. 2018 Dec 7;19(12):3922. doi: 10.3390/ijms19123922. Int J Mol Sci. 2018. PMID: 30544507 Free PMC article. Review. - Macroautophagy is defective in mucolipin-1-deficient mouse neurons.
Curcio-Morelli C, Charles FA, Micsenyi MC, Cao Y, Venugopal B, Browning MF, Dobrenis K, Cotman SL, Walkley SU, Slaugenhaupt SA. Curcio-Morelli C, et al. Neurobiol Dis. 2010 Nov;40(2):370-7. doi: 10.1016/j.nbd.2010.06.010. Epub 2010 Jun 28. Neurobiol Dis. 2010. PMID: 20600908 Free PMC article. - Diminished MTORC1-Dependent JNK Activation Underlies the Neurodevelopmental Defects Associated with Lysosomal Dysfunction.
Wong CO, Palmieri M, Li J, Akhmedov D, Chao Y, Broadhead GT, Zhu MX, Berdeaux R, Collins CA, Sardiello M, Venkatachalam K. Wong CO, et al. Cell Rep. 2015 Sep 29;12(12):2009-20. doi: 10.1016/j.celrep.2015.08.047. Epub 2015 Sep 17. Cell Rep. 2015. PMID: 26387958 Free PMC article.
References
- Awasaki T, Tatsumi R, Takahashi K, Arai K, Nakanishi Y, Ueda R, Ito K. Essential role of the apoptotic cell engulfment genes draper and ced-6 in programmed axon pruning during Drosophila metamorphosis. Neuron. 2006;50:855–867. - PubMed
- Bach G. Mucolipin 1: endocytosis and cation channel-a review. Pflugers Arch. 2005 - PubMed
- Badre NH, Martin ME, Cooper RL. The physiological and behavioral effects of carbon dioxide on Drosophila melanogaster larvae. Comp. Biochem. Physiol. A Mol. Integr. Physiol. 2005;140:363–376. - PubMed
- Bargal R, Avidan N, Ben-Asher E, Olender Z, Zeigler M, Frumkin A, Raas-Rothschild A, Glusman G, Lancet D, Bach G. Identification of the gene causing mucolipidosis type IV. Nat. Genet. 2000;26:118–123. - PubMed
Publication types
MeSH terms
Substances
LinkOut - more resources
Full Text Sources
Other Literature Sources
Molecular Biology Databases
Miscellaneous
