Amoeboid T lymphocytes require the septin cytoskeleton for cortical integrity and persistent motility - PubMed (original) (raw)
Amoeboid T lymphocytes require the septin cytoskeleton for cortical integrity and persistent motility
Aaron J Tooley et al. Nat Cell Biol. 2009 Jan.
Abstract
The systems that refine actomyosin forces during motility remain poorly understood. Septins assemble on the T-cell cortex and are enriched at the mid-zone in filaments. Septin knockdown causes membrane blebbing, excess leading-edge protrusions and lengthening of the trailing-edge uropod. The associated loss of rigidity permits motility, but cells become uncoordinated and poorly persistent. This also relieves a previously unrecognized restriction to migration through small pores. Pharmacologically rigidifying cells counteracts this effect, and relieving cytoskeletal rigidity synergizes with septin depletion. These data suggest that septins tune actomyosin forces during motility and probably regulate lymphocyte trafficking in confined tissues.
Figures
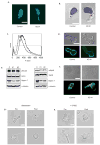
Figure 1. Septin Complexes form in T cells, assemble on the cortex and form filaments and puncta in the mid-zone
(a) Septins form heteromeric complexes in D10 T cells. Septins 1, 6, 7 or 9 were immunoprecipitated from D10 lysate and blotted for expressed septins. Normal rabbit serum was used to pre-clear (PC) the lysate and as a control for the immunoprecipitation (C). The band present in all samples in the Sept9 blot corresponds to the heavy chain (HC) of the antibody used for the immunoprecipitation. (b) Septins localize to the cell cortex in crawling D10 T cells and are frequently enriched in the mid-zone. Crawling D10 T cells were fixed and stained for Septins 1, 6, 7 (shown) and 9 (anti-Sept8 antibodies did not reproducibly stain fixed cells) and the portion of samples with significant enrichment at the mid-zone was quantified by blind-scoring Sept7 (n = 67), Sept9 (n = 64), Sept1 (n = 66), Sept6 (n=68). A three-dimensional reconstruction of a transverse section (indicated by the white box), demonstrating the presence of an annular Sept7 collar at the T cell mid-zone. Bar, 10 μm, LE = leading edge, U = uropod. Pooled totals from three independent experiments. (c) Confocal images of anti-Sept7 staining were acquired, and a maximum intensity projection was compiled. Distinct punctate and fibrous regions of Sept7 are found in the T cell mid-zone and uropod, indicating the presence of septin filaments. All are at or near the cortex (2 others are shown in supplemental Movie SM1). (d) Composite TIRF and wide-field imaging also demonstrates that fibrous Septin7 is at or near the coverslip surface. Cells were stained with anti-Septin7 and illuminated by TIRF (shown as pseudocolor) or widefield (shown as green) illumination. Scale bars in c and d are 3 and 10 μm, respectively.
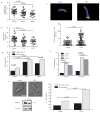
Figure 2. Septin knock-down in T cells results in augmented length and bending of uropods
(a) Individual shRNAs against Septins 1, 6, 7, 9 and a negative control shRNA (C = control) were transfected into D10 T cells. Protein levels were examined by Western blotting 72 hours post-transfection. KD of Sept7 results in the loss of all other known septins. For Sept9, only the predominant 40 kD isoform is shown; however, the larger isoforms are reduced as well (data not shown). This result confirms the specificity of the antibodies used throughout this study. (b) Reduction in septin complexes is specific to Sept7. A second shRNA at a distinct location was generated to confirm the results were specific to targeting Sept7. (c) Sept7KD D10 T cells have morphological defects as exhibited by an increase in uropod length. Hoechst 33342 was used to distinguish the nucleus (highlighted in blue) from the cytoplasm. (d) Increased uropod length in Sept7KD T cells. A line was drawn from the end of the uropod to the nucleus (black line). Sept7KD#1 (n = 107), Sept7KD#2 (n = 108) and control shRNA treated cells (n = 97). (e) Normal cell body length in Sept7KD T cells, measured as in d for cell body region (red line in d). (f) Bent uropods in the absence of septin complexes. A uropod was scored as bent if a straight line could not be drawn through the cell from the distal tip of the uropod to the beginning of the nucleus. KD #1, n = 107, KD #2, n = 108 and shRNA control cells, n = 97). (d, e) Representative mean ± standard deviation pooled from three independent experiments. Statistical analysis performed using a Kruskal-Wallis test with Dunn’s post-test. (f) Pooled total from three independent experiments, statistical analysis performed using the chi-squared test.
Figure 3. Septin complexes are required for structural stability of the cell cortex and at the T cell mid-zone
(a) Sept7KD T cells have structural defects resulting in membrane blebbing and excess membrane protrusions (also see Supplementary movies SM2, SM3 and SM4). Membrane blebbing was dynamic and mainly confined to the cell body. Excess protrusions emanated from both the leading edge and the T cell mid-zone and persisted as long, thin membrane appendages that were eventually re-absorbed in the mid-zone/rear. Scale bar represents 10 μm (b) Quantification of structural defects observed in Sept7KD T cells. Pooled totals from three independent experiments. Statistical analysis performed using the chi-squared test.
Figure 4. Integrity of Tubulin and Actomyosin Cytoskeletons in Septin-deficient T cells
The tubulin cytoskeleton was assessed using DAPI (blue) and anti-tubulin (green) (a) or anti-pericentrin (red) (b) antibodies in control and Sept7KD cells. The pericentrin-containing MTOC (red) was correctly positioned behind the nucleus (DAPI, blue) in greater than 97% of both control and septin deficient cells with at least 34 cells scored. (c) FACS analysis of phalloidin staining. F-actin levels were slightly reduced in Septin-deficient cells. (control = bold line, KD #1 = solid line, KD #2 = dotted line). Levels of total actin were not altered in these cells (shown in e). Similar results were obtained in three independent experiments (d) Overall distribution of actin as assessed by immunofluorescence was cortical for both control and Sept7KD cells. (e) Myosin II was not over-active in Sept7KD T cells. Lysates from control or Sept7KD cells were assessed by Western blotting for the phosphorylation of the myosin light chain (pMLC2 Ser19) and heavy chain (pMyh9). (f) Staining for phospho-MLC(Ser19). Active Myosin light-chain kinase was not overabundant in the mid-zone in Sept7KD cells. (g, h) Treatment of cells with the myosin II inhibitor Blebbistatin or with the ROCK inhibitor Y-27632 resulted in T cell rounding and loss of blebs, indicating these molecules were still required for uropod formation in the absence of septin complexes. T cell rounding was observed in greater than 95% of cells scored for both inhibitors, with at least 84 cells scored from three independent experiments. Results were similar for Sept7 KD #2 (data not shown). Scale bars represent 10 μm.
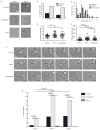
Figure 5. Septins regulate motility and transmigration
(a) Overall crawling velocity and (b) displacement over time were reduced by Sept7KD. KD #1, n = 31, KD #2, n = 29 and control treated cells n = 39. Similar results were obtained in three independent experiments. Statistical analysis was performed using Kruskal-Wallis tests with Dunn’s post-tests. (c) Top panels show representative frames from analysis of extra-nuclear path volume. The path of the nucleus over the entire time course is shown in blue. Measured cell body volume deviating from that path is represented in green. The red line shows the outline of the entire cell volume, for reference. The bottom panel shows analysis of multiple time points for at least 10 different cells and a Mann-Whitney U test indicates that Sept7KD cells make significantly more protrusions out of the direction of motility than control cells. (d) Responsiveness of control and Sept7KD T cells to MIP-1α chemokine gradients in a transwell assay using 8μm pores. Both control and Sept7KD cells had weak migration to the chemokine, but Sept7KD cells passed through the pores approximately 2-fold better than control cells. (e) Sept7KD T cells transmigrate through extremely small pores whereas control cells are constrained from passage. Transmigration (in the absence of chemokine) was assessed using transwells with 3 μm and 5 μm pores. Similar results were obtained in three independent experiments. (f) Sept7KD DO11.10 T cell blasts show a similar extended-uropod phenotype to Sept7KD D10 cells. Scale bar represents 10 μm. (e) Sept7KD DO11.10 cells transmigrate more efficiently in response to CCL21 than control cells. Transwell inserts with 5 μm pores were used in these assays. Data shown is representative of two experiments.
Figure 6. Septins and microtubules regulate rigidity and transmigration
(a) Images of control or Sept7KD D10 were taken after treatment with no drug, 5 μM nocodazole or 5 μM taxol for at least 30 minutes. (b) Taxol treatment caused both Sept7KD and control cells to become rounded implying a dependence of the Sept7KD phenotype on microtubule function. (c) Septin depletion and nocodazole treatment both caused an increase in the number of protrusions made by cells in a 10-minute observation period. Analysis represents greater than 30 cells per group. Duration of protrusions (e) but not protrusion length (d) was significantly increased in both Sept7KD and nocodazole-treated cells relative to control cells. Analysis in (d) and (e) is of the first protrusion observed in each cell from (c), and was done using the Kruskal-Wallis test with Dunn’s post-test (f) Representative time lapse images of protrusions observed in control, Sept7KD, and nocodazole-treated cells. (g) Nocodazole caused chemokine-independent transmigration of D10 cells through 3 μm pores similar to, and synergizing with, that observed in Sept7KD cells. This nonspecific transmigration was completely abolished by taxol treatment. Cells were treated with drugs for 30 min prior to the beginning of the four-hour assay. Data shown is representative of two independent experiments. Scale bars represent 10 μm.
Comment in
- Undressing a cellular corset: septins exposed.
Srougi MC, Burridge K. Srougi MC, et al. Nat Cell Biol. 2009 Jan;11(1):9-10. doi: 10.1038/ncb0109-9. Nat Cell Biol. 2009. PMID: 19122592 No abstract available.
Similar articles
- Undressing a cellular corset: septins exposed.
Srougi MC, Burridge K. Srougi MC, et al. Nat Cell Biol. 2009 Jan;11(1):9-10. doi: 10.1038/ncb0109-9. Nat Cell Biol. 2009. PMID: 19122592 No abstract available. - The septin cytoskeleton facilitates membrane retraction during motility and blebbing.
Gilden JK, Peck S, Chen YC, Krummel MF. Gilden JK, et al. J Cell Biol. 2012 Jan 9;196(1):103-14. doi: 10.1083/jcb.201105127. J Cell Biol. 2012. PMID: 22232702 Free PMC article. - Regulation of cortical actin networks in cell migration.
Suetsugu S, Takenawa T. Suetsugu S, et al. Int Rev Cytol. 2003;229:245-86. doi: 10.1016/s0074-7696(03)29006-9. Int Rev Cytol. 2003. PMID: 14669958 Review. - Actin-Membrane Release Initiates Cell Protrusions.
Welf ES, Miles CE, Huh J, Sapoznik E, Chi J, Driscoll MK, Isogai T, Noh J, Weems AD, Pohlkamp T, Dean K, Fiolka R, Mogilner A, Danuser G. Welf ES, et al. Dev Cell. 2020 Dec 21;55(6):723-736.e8. doi: 10.1016/j.devcel.2020.11.024. Epub 2020 Dec 11. Dev Cell. 2020. PMID: 33308479 Free PMC article. - Control of cortical rigidity by the cytoskeleton: emerging roles for septins.
Gilden J, Krummel MF. Gilden J, et al. Cytoskeleton (Hoboken). 2010 Aug;67(8):477-86. doi: 10.1002/cm.20461. Cytoskeleton (Hoboken). 2010. PMID: 20540086 Free PMC article. Review.
Cited by
- Engineering T cells to enhance 3D migration through structurally and mechanically complex tumor microenvironments.
Tabdanov ED, Rodríguez-Merced NJ, Cartagena-Rivera AX, Puram VV, Callaway MK, Ensminger EA, Pomeroy EJ, Yamamoto K, Lahr WS, Webber BR, Moriarity BS, Zhovmer AS, Provenzano PP. Tabdanov ED, et al. Nat Commun. 2021 May 14;12(1):2815. doi: 10.1038/s41467-021-22985-5. Nat Commun. 2021. PMID: 33990566 Free PMC article. - Lymphocyte egress signal sphingosine-1-phosphate promotes ERM-guided, bleb-based migration.
Robertson TF, Chengappa P, Gomez Atria D, Wu CF, Avery L, Roy NH, Maillard I, Petrie RJ, Burkhardt JK. Robertson TF, et al. J Cell Biol. 2021 Jun 7;220(6):e202007182. doi: 10.1083/jcb.202007182. J Cell Biol. 2021. PMID: 33764397 Free PMC article. - Septin/anillin filaments scaffold central nervous system myelin to accelerate nerve conduction.
Patzig J, Erwig MS, Tenzer S, Kusch K, Dibaj P, Möbius W, Goebbels S, Schaeren-Wiemers N, Nave KA, Werner HB. Patzig J, et al. Elife. 2016 Aug 9;5:e17119. doi: 10.7554/eLife.17119. Elife. 2016. PMID: 27504968 Free PMC article. - The last-born daughter cell contributes to division orientation of Drosophila larval neuroblasts.
Loyer N, Januschke J. Loyer N, et al. Nat Commun. 2018 Sep 14;9(1):3745. doi: 10.1038/s41467-018-06276-0. Nat Commun. 2018. PMID: 30218051 Free PMC article.
References
- Snapper SB, et al. WASP deficiency leads to global defects of directed leukocyte migration in vitro and in vivo. J Leukoc Biol. 2005;77:993–8. - PubMed
- Snapper SB, et al. N-WASP deficiency reveals distinct pathways for cell surface projections and microbial actin-based motility. Nat Cell Biol. 2001;3:897–904. - PubMed
- Jacobelli J, Chmura SA, Buxton DB, Davis MM, Krummel MF. A Single Class II Myosin Modulates T cell Motility and Stopping But Not Synapse Assembly. Nature Immunology. 2004;5:531–538. - PubMed
Publication types
MeSH terms
Substances
Grants and funding
- R21 AI062899/AI/NIAID NIH HHS/United States
- R01 AI052116/AI/NIAID NIH HHS/United States
- R21 AI062899-02/AI/NIAID NIH HHS/United States
- R01 AI052116-06A2/AI/NIAID NIH HHS/United States
- R21-AI062899/AI/NIAID NIH HHS/United States
LinkOut - more resources
Full Text Sources
Other Literature Sources
Molecular Biology Databases
Research Materials


