Deletion of the SOCS box of suppressor of cytokine signaling 3 (SOCS3) in embryonic stem cells reveals SOCS box-dependent regulation of JAK but not STAT phosphorylation - PubMed (original) (raw)
Deletion of the SOCS box of suppressor of cytokine signaling 3 (SOCS3) in embryonic stem cells reveals SOCS box-dependent regulation of JAK but not STAT phosphorylation
Kristy Boyle et al. Cell Signal. 2009 Mar.
Abstract
The mechanism by which Suppressor of Cytokine Signaling-3 (SOCS3) negatively regulates cytokine signaling has been widely investigated using over-expression studies in cell lines and is thought to involve interactions with both the gp130 receptor and JAK1. Here, we compare the endogenous JAK/STAT signaling pathway downstream of Leukemia Inhibitory Factor (LIF) signaling in wild type (WT) Embryonic Stem (ES) cells and in ES cells lacking either the entire Socs3 gene or bearing a truncated form of SOCS3 (SOCS3DeltaSB) lacking the C-terminal SOCS box motif (SOCS3(DeltaSB/DeltaSB)). In SOCS3(DeltaSB/DeltaSB) cells phosphorylated JAK1 accumulated at much higher levels than in WT cells or even cells lacking SOCS3 (SOCS3(-/-)). In contrast enhanced activation of STAT3 and SHP2 was seen in SOCS3(-/-) cells. Size exclusion chromatography of cell extracts showed that in unstimulated cells, JAK1 was exclusively associated with receptors but following cytokine stimulation hyperphosphorylated JAK1 (pJAK1) appeared to dissociate from the receptor complex in a manner independent of SOCS3. In WT and SOCS3(DeltaSB/DeltaSB) cells SOCS3 was associated with pJAK1. The data suggest that dissociation of activated JAK1 from the receptor results in separate targeting of JAK1 for proteasomal degradation through a mechanism dependent on the SOCS3 SOCS box thus preventing further activation of STAT3.
Figures
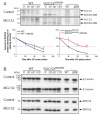
Figure 1. Effect of deletion of the SOCS box on SOCS3 protein half-life and SOCS3 protein production
(A) WT and SOCS3ΔSB/ΔSBES cells were left untreated (NT), starved for 6 hours (SO), or stimulated with LIF for 1 h (0′), then washed and cultured in starvation media for 15 min to 4 h. Cells were lysed at the indicated time points, immunoprecipitated with anti SOCS3 antibody and subjected to SDS PAGE. Membranes were immunoblotted with anti SOCS3 antibody to detect full-length SOCS3 (SOCS3) and SOCS box deleted SOCS3 (SOCS3DSB) proteins. (B) WT and SOCS3ΔSB/ΔSBES cells were starved of LIF, FCS, cysteine and methionine for 6 h, then stimulated with LIF in the presence of [35S]-cysteine/methionine for 1 h. Cells were either lysed at the conclusion of stimulation (0′) or washed and chased for 30 120 min in ES cell media supplemented with unlabelled cysteine/methionine. Whole cell lysates were immunoprecipitated with an anti SOCS3 antibody and subjected to SDS PAGE on a polyacrylamide gel. Incorporation of [35S]-was measured using a PhosphoImager. Band intensity was quantified from four separate experiments and graphed as a percentage of the starting amount of protein at the conclusion of stimulation (0′). (C) WT and SOCS3ΔSB/ΔSB ES cells were starved of LIF, FCS, cysteine, and methionine for 6 h and then stimulated with LIF in the presence of [35S]-cysteine/methionine for 15 90 min. Cells were processed as in B and the results of three separate experiments graphed as a percentage of the total amount of protein at the 90 min stimulation (90′). (NT ES cells cultured in ES cell medium with LIF (100ng/ml), SO ES cells starved for 6 h) * indicates p < 0.05.
Figure 2. SOCS3 protein is degraded by the proteasome
(A) WT and SOCS3ΔSB/ΔSB ES cells were incubated in ES cell media without cysteine, methionine or LIF for 6 h, after which SOCS3 protein was no longer detectable. Cultures were then stimulated with LIF in the presence of [35S]-cysteine/methionine for 1 h. Cells were lysed after stimulation (0′) or washed and chased for 30 to 120 min after stimulation in the absence (control) or presence of MG132. Whole cell lysates were immunoprecipitated with anti SOCS3 antibody and subjected to SDS PAGE. Labeled full-length SOCS3 and SOCS3DSB proteins were detected by PhosphoImager. Bands were quantitated and are expressed as a percentage of the starting amount of protein at the conclusion of stimulation (0′). The mean ± SD of three experiments with full-length SOCS3 protein (WT) and with MG132 treated SOCS3 (WT + MG132) is shown on one graph and of three SOCS3DSB and MG132 treated SOCS3DSB (SOCS3DSB + MG132) experiments on another. (B) Remaining lysates from (A) were subject to SDS PAGE and immunoblotted with antibodies against β-Catenin, and ERK1/2 to confirm proteasomal inhibition by MG132 and equal protein loading. * indicates p < 0.05, ** indicates p < 0.01
Figure 3. Enhanced JAK1 phosphorylation in SOCS3DSB/DSB ES cells in response to LIF
WT, SOCS3DSB/DSB, and SOCS3-/- ES cells were washed, starved of LIF and FCS for 6 h and restimulated with LIF for 5 to 120 min. Lysates were separated by SDS PAGE and probed with antibodies to phosphorylated JAK1 (pJAK1), phosphorylated STAT3 (pSTAT3), and phosphorylated SHP2 (pSHP2) protein. Membranes were stripped and re probed with antibodies to total JAK1, STAT3, and SHP2 protein.
Figure 4. The half-life of phosphorylated JAK1 is prolonged in the absence of the SOCS box
(A) WT, SOCS3DSB/DSB and SOCS3-/- ES cells were starved of LIF and FCS for 6 h then restimulated with LIF in the presence of 10 KM MG132 for 1 h. Whole cell lysates were prepared, quantitated and immunoprecipitated with an antibody to JAK1. Immunoprecipitates were subject to an in vitro kinase assay, radiolabeled proteins were then separated by SDS PAGE, transferred to PVDF membranes and incorporation of [γ32P]-ATP analysed using a PhosphoImager. Membranes were subsequently immunoblotted with antibodies to phosphorylated and total JAK1. Result shown is representative of three separate experiments. (B) WT and SOCS3DSB/DSB ES cells were starved of LIF, FCS, cysteine and methionine for 6 h, incubated with [35S]-cysteine/methionine for 45 min, then stimulated with LIF in the presence of [35S]-cysteine/methionine for 15 min. Cells were either lysed at the conclusion of stimulation (0′) or washed and chased for 5 120 min. Whole cell lysates were immunoprecipitated with an antibody to pJAK1, subjected to SDS PAGE, and incorporation of [35S] was analysed on a PhosphoImager. Bands were quantitated from three separate experiments and graphed as a percentage of the starting amount of protein at the conclusion of stimulation (0′). (C) WT and SOCS3DSB/DSB ES cells were either left untreated (NT), starved for 6 h of LIF and FCS (SO), or re stimulated with LIF for 5 120 min in the presence or absence of MG132. Cells were lysed and separated by SDS PAGE, then probed with an antibody to pJAK1. Membranes were re blotted with an antibody to total JAK1. D WT and SOCS3DSB/DSB ES cells were treated and analysed as in (B) with the exception that the chase period was performed in the presence or absence of MG132. * indicates p<0.05, ** indicates p<0.01
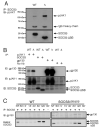
Figure 5. SOCS3, gp130 and phosphorylated JAK1 associate downstream of LIF
(A) WT and SOCS3DSB/DSB ES cells were starved of LIF and FCS for 6 h and subsequently stimulated with LIF for 1 h and lysed. Lysates were immunoprecipitated with an antibody to SOCS3, separated by SDS PAGE and probed with an antibody to pJAK1. The membrane was stripped and re probed with an antibody to SOCS3. (B) WT and SOCS3DSB/DSB ES cells were starved of LIF and FCS for 6 h and re stimulated with LIF for 1 h and lysed. Lysates were immunoprecipitated with antibodies to phosphorylated JAK1, SOCS3, or gp130, separated by SDS PAGE and immunoblotted with an antibody to gp130. The membrane was stripped and re probed with an antibody to pJAK1 and subsequently with an antibody to SOCS3. Control lysates received no antibody for immunoprecipitation (No Ab). (C) WT and SOCS3DSB/DSB ES cells were starved of LIF and FCS (SO) for 6 h then re stimulated with 100 ng/mL LIF and 10 KM MG132 for 5 120 min, lysed, and immunoprecipitated with an antibody to SOCS3. Lysates were separated by SDS PAGE and probed with an antibody to gp130 then scanned on the LiCor scanner. Membranes were stripped and re probed with antibodies to phosphorylated JAK1 and subsequently SOCS3. ( indicates lysates received no IP antibody, IP immunoprecipitated, IB immunoblotted, NT ES cells in routine culture, SO starved ES cells)
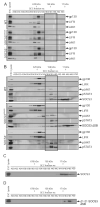
Figure 6. During the attenuation of JAK/STAT signaling, SOCS3, gp130 and phosphorylated JAK1 serially form complexes
WT, SOCS3DSB/DSB, and SOCS3-/- ES cells were either (A) starved of LIF and FCS for 6 h or (B) starved for 6 h then restimulated with LIF for 1 h. Cells were lysed and whole cell lysates fractionated by size exclusion chromatography. The column was calibrated with BioRad gel filtration standard containing equine myoglobin (17 kDa), chicken ovalbumin (44 kDa), bovine γ-globulin (158 kDa), and thyroglobulin dimer (670 kDa). Retention time of standards was graphed against molecular weight to generate a standard curve in order to determine MW of fractions as shown. Every second fraction from #20-50 was separated by SDS PAGE and membranes were immunoblotted with antibodies to gp130, LIFR, pJAK1, pSTAT3, JAK1 and SOCS3. The boxes indicate the formation of a SOCS3:pJAK1 complex upon LIF stimulation which is absent in starved cells. (C) Recombinant SOCS3 protein was fractionated by size exclusion chromatography and immunoblotted with an antibody to SOCS3. (D) A recombinant His-tagged SOCS3 protein lacking the first 21 amino acids and the SOCS box was chromatographed and immunoblotted with an antibody to the His-tag.
Figure 7. pJAK1 dissociation occurs independently of SOCS3
This experiment was performed exactly as for Fig. 6 except that the LIF stimulation time was 15 min, a time at which SOCS3 is not induced.
Figure 8. The mechanism of phosphorylated JAK1 degradation by SOCS3 and the SOCS box
(A) LIF binding to the gp130:LIFR heterodimer induces auto phosphorylation of associated JAK1, which subsequently phosphorylates receptor tyrosines. STAT3 binds to phosphorylated tyrosines on gp130, becomes phosphorylated, dimerises and translocates to the nucleus where it induces transcription of SOCS3. SOCS3 binds to phosphorylated tyrosine 757 on gp130 and may undergo a conformational change. (B) SOCS3 then binds to pJAK1, which is destined for release from the receptor. (C) SOCS3:pJAK1 complex is released from the receptor complex, thereby inhibiting further STAT3 activation as tyrosines within the intracellular domain are no longer being phosphorylated by JAK1. SOCS3 then promotes the proteasomal degradation of pJAK1 most likely through interactions with Elongin B/C and Cullin5/Rbx2 to ubiquitinate pJAK1 and target it for degradation thus preventing re binding to the receptor.
Similar articles
- Leukemia inhibitory factor regulates trophoblast giant cell differentiation via Janus kinase 1-signal transducer and activator of transcription 3-suppressor of cytokine signaling 3 pathway.
Takahashi Y, Takahashi M, Carpino N, Jou ST, Chao JR, Tanaka S, Shigeyoshi Y, Parganas E, Ihle JN. Takahashi Y, et al. Mol Endocrinol. 2008 Jul;22(7):1673-81. doi: 10.1210/me.2008-0058. Epub 2008 May 1. Mol Endocrinol. 2008. PMID: 18451094 Free PMC article. - SOCS3 negatively regulates LIF signaling in neural precursor cells.
Emery B, Merson TD, Snell C, Young KM, Ernst M, Kilpatrick TJ. Emery B, et al. Mol Cell Neurosci. 2006 Apr;31(4):739-47. doi: 10.1016/j.mcn.2006.01.005. Epub 2006 Feb 23. Mol Cell Neurosci. 2006. PMID: 16497512 - CUEDC2 (CUE domain-containing 2) and SOCS3 (suppressors of cytokine signaling 3) cooperate to negatively regulate Janus kinase 1/signal transducers and activators of transcription 3 signaling.
Zhang WN, Wang L, Wang Q, Luo X, Fang DF, Chen Y, Pan X, Man JH, Xia Q, Jin BF, Li WH, Li T, Liang B, Chen L, Gong WL, Yu M, Li AL, Zhou T, Li HY. Zhang WN, et al. J Biol Chem. 2012 Jan 2;287(1):382-392. doi: 10.1074/jbc.M111.276832. Epub 2011 Nov 14. J Biol Chem. 2012. PMID: 22084247 Free PMC article. - Can the protective actions of JAK-STAT in the heart be exploited therapeutically? Parsing the regulation of interleukin-6-type cytokine signaling.
Kurdi M, Booz GW. Kurdi M, et al. J Cardiovasc Pharmacol. 2007 Aug;50(2):126-41. doi: 10.1097/FJC.0b013e318068dd49. J Cardiovasc Pharmacol. 2007. PMID: 17703129 Review. - The biology and mechanism of action of suppressor of cytokine signaling 3.
Babon JJ, Nicola NA. Babon JJ, et al. Growth Factors. 2012 Aug;30(4):207-19. doi: 10.3109/08977194.2012.687375. Epub 2012 May 11. Growth Factors. 2012. PMID: 22574771 Free PMC article. Review.
Cited by
- SOCS-1 mediates ubiquitylation and degradation of GM-CSF receptor.
Bunda S, Kommaraju K, Heir P, Ohh M. Bunda S, et al. PLoS One. 2013 Sep 26;8(9):e76370. doi: 10.1371/journal.pone.0076370. eCollection 2013. PLoS One. 2013. PMID: 24086733 Free PMC article. - SOCS3: An essential physiological inhibitor of signaling by interleukin-6 and G-CSF family cytokines.
White CA, Nicola NA. White CA, et al. JAKSTAT. 2013 Oct 1;2(4):e25045. doi: 10.4161/jkst.25045. Epub 2013 Jun 11. JAKSTAT. 2013. PMID: 24416642 Free PMC article. Review. - Three lysine residues in the common β chain of the interleukin-5 receptor are required for Janus kinase (JAK)-dependent receptor ubiquitination, endocytosis, and signaling.
Lei JT, Mazumdar T, Martinez-Moczygemba M. Lei JT, et al. J Biol Chem. 2011 Nov 18;286(46):40091-103. doi: 10.1074/jbc.M111.273482. Epub 2011 Sep 30. J Biol Chem. 2011. PMID: 21965659 Free PMC article. - Influenza a virus antagonizes type I and type II interferon responses via SOCS1-dependent ubiquitination and degradation of JAK1.
Du Y, Yang F, Wang Q, Xu N, Xie Y, Chen S, Qin T, Peng D. Du Y, et al. Virol J. 2020 Jun 12;17(1):74. doi: 10.1186/s12985-020-01348-4. Virol J. 2020. PMID: 32532301 Free PMC article. - STATs: An Old Story, Yet Mesmerizing.
Abroun S, Saki N, Ahmadvand M, Asghari F, Salari F, Rahim F. Abroun S, et al. Cell J. 2015 Fall;17(3):395-411. doi: 10.22074/cellj.2015.1. Epub 2015 Oct 7. Cell J. 2015. PMID: 26464811 Free PMC article. Review.
References
- Alexander WS. Nature Immunology Reviews. 2002;2:1–7.
- Cappellen D, Nguyen NH Luong, Bongiovanni S, Grenet O, Wanke C, Susa M. J Biol Chem. 2002;277(24):21971–21982. - PubMed
Publication types
MeSH terms
Substances
LinkOut - more resources
Full Text Sources
Other Literature Sources
Research Materials
Miscellaneous


