HOXA9 is required for survival in human MLL-rearranged acute leukemias - PubMed (original) (raw)
HOXA9 is required for survival in human MLL-rearranged acute leukemias
Joerg Faber et al. Blood. 2009.
Abstract
Leukemias that harbor translocations involving the mixed lineage leukemia gene (MLL) possess unique biologic characteristics and often have an unfavorable prognosis. Gene expression analyses demonstrate a distinct profile for MLL-rearranged leukemias with consistent high-level expression of select Homeobox genes, including HOXA9. Here, we investigated the effects of HOXA9 suppression in MLL-rearranged and MLL-germline leukemias using RNA interference. Gene expression profiling after HOXA9 suppression demonstrated co-down-regulation of a program highly expressed in human MLL-AML and murine MLL-leukemia stem cells, including HOXA10, MEIS1, PBX3, and MEF2C. We demonstrate that HOXA9 depletion in 17 human AML/ALL cell lines (7 MLL-rearranged, 10 MLL-germline) induces proliferation arrest and apoptosis specifically in MLL-rearranged cells (P = .007). Similarly, assessment of primary AMLs demonstrated that HOXA9 suppression induces apoptosis to a greater extent in MLL-rearranged samples (P = .01). Moreover, mice transplanted with HOXA9-depleted t(4;11) SEMK2 cells revealed a significantly lower leukemia burden, thus identifying a role for HOXA9 in leukemia survival in vivo. Our data indicate an important role for HOXA9 in human MLL-rearranged leukemias and suggest that targeting HOXA9 or downstream programs may be a novel therapeutic option.
Figures
Figure 1
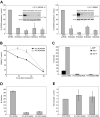
ShRNA-mediated knockdown of HOXA9 expression in human t(9;11) MOLM-14 and t(4;11) SEMK2 cells and murine leukemia stem cells (L-GMP). (A) Quantitative real-time PCR analysis of HOXA9 expression 72 hours after transduction of MOLM-14 and SEMK2 cells with 1 of 4 different HOXA9 shRNA constructs (1F2-HOXA9shRNA, 1F3-HOXA9shRNA, 2A4-HOXA9shRNA, and 2A5-HOXA9shRNA) without puromycin selection. A highly efficient HOXA9 suppression is demonstrated compared with a nontargeting control shRNA directed toward GFP. Western blot analysis 72 hours after transduction confirmed HOXA9 protein knockdown. (B) HoxA9 depletion in highly purified murine leukemia stem cells (L-GMP) resulted in a progressive induction of apoptosis in liquid culture compared with cells transduced with a control shRNA. (C) Analysis of L-GMP colony formation and replating capacity after HoxA9 suppression. Colonies were counted and replated at day 8. A significant decrease in colony number and replating capacity is demonstrated for L-GMPs transduced with _HoxA9_-directed shRNA without puromycin selection. (D) Analysis of L-GMP colony formation after HOXA9 suppression in a mixed-populations assay. L-GMPs were transduced with 1F2-HOXA9shRNA, 1F3-HOXA9shRNA, or GFP-control shRNA constructs, and populations of HOXA9shRNA or GFP-control shRNA-transduced cells were mixed in a ratio of 9:1 (HOXA9shRNA-transduced cells/GFP-control shRNA-transduced cells) and plated in semisolid medium. The total number of colonies at day 8 is shown for the mixed populations (1F2-HOXA9shRNA/GFP-control-shRNA; 1F3-HOXA9shRNA/GFP-control-shRNA) and the controls containing only GFP-control shRNA-transduced cells. (E) Quantitative real-time PCR further demonstrated similar HOXA9 expression in colonies that arose from the mixed HOXA9shRNA/GFP-control shRNA populations and controls containing only GFP-control shRNA-transduced cells (day 8).
Figure 2
Analysis of phenotypic consequences after shRNA-mediated HOXA9 suppression in t(9;11) MOLM-14 AML and t(4;11) SEMK2 ALL cells. (A) Analysis of cell viability as measured by annexin V/PI positivity at day 7 after transduction of t(9,11) MOLM-14 cells and t(4;11) SEMK2 cells with 1 of 4 HOXA9 targeted shRNAs or GFP control shRNA. The percentage of viable (annexin V/PI negative) cells is shown in the HOXA9shRNA and GFP control shRNA-transduced group. (B) Time course analysis of cell viability as measured by annexin V/PI positivity after HOXA9 suppression in an independent experiment. Cells were transduced with either 1 of 4 HOXA9 targeted shRNAs or GFP-control shRNA. The data are graphed as percentage of viable cells that were transduced with HOXA9shRNA/percentage of viable cells that were transduced with GFP-control shRNA at a given time point. These results were confirmed 3 times. (C) Quantitative real-time PCR and Western blot analysis of ectopic HOXA9 overexpression in t(9;11) MOLM-14 cells compared with untransduced cells and cells transduced with the empty vector construct. (D) MOLM-14 cells ectopically overexpressing HOXA9 were transduced with the 2A4-HOXA9shRNA construct specifically targeting the 3′-untranslated region of endogenous HOXA9 or the GFP-control shRNA construct. Ectopic overexpression of HOXA9 almost completely rescued the phenotype (annexin V/PI staining).
Figure 3
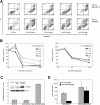
Effects of HOXA9 suppression in human t(9;11) MOLM-14 and t(4;11) SEMK2 cells. (A) Fluorescence-activated cell sorter analysis of cell-cycle status after transduction of MOLM-14 cells with 1F3-HOXA9shRNA after PI staining. A progressive increase of cells in G1 phase and a decrease of cells in G2 and S phases were noted compared with control GFP-shRNA–transduced cells with onset 24 to 36 hours before induction of apoptosis. (B) Analysis of mRNA expression of myeloid differentiation markers M-CSF1R, PU.1, and ITGAM (CD11b) and the granule molecules lysozyme (LYZ), myeloperoxidase (MPO), and elastaseA2 (ELA2) associated with terminal myeloid differentiation by quantitative real-time PCR 72 hours after HOXA9shRNA transduction. Compared with control GFP-shRNA transduced cells, a significant induction of mRNA expression was observed. (C) Gene expression analysis 44 hours after HOXA9 suppression in t(9;11) MOLM-14 cells with 2 different HOXA9shRNAs (1F3-HOXA9shRNA; 2A5-HOXA9shRNA) in triplicates compared with GFP-shRNA–transduced controls. Analysis of concomitant expression changes in other Homeobox A-D cluster genes demonstrated co–down-regulation of 5′-HOXA cluster gens in the HOXA9 suppression signature. (D) GSEA of the top 500 genes down-regulated after HOXA9 suppression in a gene expression dataset of 56 human AML patients. The HOXA9 suppression gene set is significantly enriched in a signature previously identified as more highly expressed in MLL-AML compared with other genetically defined AML subtypes (ES = 0.48; P < .001). (E) Confirmation of co–down-regulation of 5′-HOXA cluster genes as well as the HOXA9 cofactors MEIS1 and PBX3 and the transcription factor MEF2C in t(4;11) SEMK2 cells (quantitative real-time PCR analysis).
Figure 4
Induction of apoptosis by HOXA9 suppression is significantly correlated with the presence of the _MLL_-fusion oncogene. (A) Analysis of cell viability at day 7 after HOXA9 shRNA transduction in a larger panel of 11 AML/ALL cell lines (6 _MLL_-rearranged; 5 _MLL_-wild-type) showing significantly higher apoptosis induction in _MLL_-rearranged cells with all 4 HOXA9shRNA constructs. (B) Independent analysis in a panel of 17 AML/ALL cell lines (7 _MLL_-rearranged; 10 _MLL_-wild-type) further demonstrated a significant correlation between cell number and baseline HOXA9 expression after shRNA-mediated suppression, with the greatest effect in cell lines expressing the highest HOXA9 levels (R = −0.8: P = .001; ●, _MLL_-rearranged cell lines;  , _MLL_-wild-type cell lines).
Figure 5
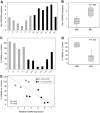
HOXA9 suppression induces apoptosis in primary _MLL_-rearranged human AML cells. (A) Analysis of baseline HOXA9 expression before shRNA transduction by quantitative real-time PCR. (B) The mean HOXA9 expression level was found to be significantly higher in primary AML patient samples bearing an MLL translocation (P = .004). (C) Analysis of apoptosis induction by annexin V staining 72 hours after transduction with the 1F3-HOXA9shRNA or control shRNA. (D) Induction of apoptosis is significantly higher in the _MLL_-rearranged group (P = .010). (E) A significant correlation between baseline HOXA9 expression and impact of HOXA9 knockdown on viability is demonstrated. Samples expressing high-level HOXA9 were found to be especially susceptible to HOXA9 depletion (R = −0.8; P = .005).
Figure 6
Assessment of the effects of HOXA9 suppression in vivo using bioluminescent imaging. (A) Before transplantation, SEMK2 cells were transduced with either 1F3-HOXA9 shRNA or GFP control shRNA and injected intravenously 24 hours after transduction. Mice were imaged 2, 24, and 72 hours after injection and then weekly. (B) There was no significant difference in total body luminescence 2 hours after injection confirming that an equal number of treated cells was injected (P = .101). Repetitive longitudinal in vivo bioluminescent imaging at later time points revealed a significant difference of total body luminescence as early as 24 hours after transplantation (P = .036). Fourteen days after transplantation, the differences in total body luminescence reached a significant maximum (P = .001), shortly before the GFP shRNA–treated control group died of overt leukemia. (C) The degree of leukemic organ infiltration in both groups was assessed. The percentage of hCD19+/mCD45− SEMK2 cells was evaluated in spleens from wild-type SCID-beige mice that received 1F3-HOXA9–transduced or GFP-control–transduced cells. (D) The total number of human cells/spleen is graphed for both groups of mice. There is a 40-fold difference in total number of SEMK2 between groups (P = .001). (E) Spleen weights for are shown for mice that received either control or 1F3-HOXA9-transduced SEMK2 cells. (F) Analysis of HOXA9 expression in SEMK2 cells at the day of transplantation (day 0) confirmed efficient HOXA9 suppression (80%) in the 1F3-HOXA9 shRNA-treated group compared with control shRNA-transduced cells. Human cells were isolated from mice that received either control or 1F3-HOXA9 shRNA-transduced SEMK2 cells 14 days after injection, and the HOXA9 expression level was compared with SEMK2 cells growing in culture. The HOXA9 expression level at this time point was similar in the sorted SEMK2 cells from the 1F3-HOXA9shRNA group as in those sorted from the GFP shRNA control group (P = .244).
Comment in
- Might as well face it: MLL's addicted to HOX.
Roth JJ, Crist RC, Buchberg AM. Roth JJ, et al. Blood. 2009 Mar 12;113(11):2372-3. doi: 10.1182/blood-2009-01-197616. Blood. 2009. PMID: 19282462 No abstract available.
Similar articles
- PBX3 and MEIS1 Cooperate in Hematopoietic Cells to Drive Acute Myeloid Leukemias Characterized by a Core Transcriptome of the MLL-Rearranged Disease.
Li Z, Chen P, Su R, Hu C, Li Y, Elkahloun AG, Zuo Z, Gurbuxani S, Arnovitz S, Weng H, Wang Y, Li S, Huang H, Neilly MB, Wang GG, Jiang X, Liu PP, Jin J, Chen J. Li Z, et al. Cancer Res. 2016 Feb 1;76(3):619-29. doi: 10.1158/0008-5472.CAN-15-1566. Epub 2016 Jan 8. Cancer Res. 2016. PMID: 26747896 Free PMC article. - PBX3 is essential for leukemia stem cell maintenance in MLL-rearranged leukemia.
Guo H, Chu Y, Wang L, Chen X, Chen Y, Cheng H, Zhang L, Zhou Y, Yang FC, Cheng T, Xu M, Zhang X, Zhou J, Yuan W. Guo H, et al. Int J Cancer. 2017 Jul 15;141(2):324-335. doi: 10.1002/ijc.30739. Epub 2017 May 8. Int J Cancer. 2017. PMID: 28411381 - PBX3 is an important cofactor of HOXA9 in leukemogenesis.
Li Z, Zhang Z, Li Y, Arnovitz S, Chen P, Huang H, Jiang X, Hong GM, Kunjamma RB, Ren H, He C, Wang CZ, Elkahloun AG, Valk PJ, Döhner K, Neilly MB, Bullinger L, Delwel R, Löwenberg B, Liu PP, Morgan R, Rowley JD, Yuan CS, Chen J. Li Z, et al. Blood. 2013 Feb 21;121(8):1422-31. doi: 10.1182/blood-2012-07-442004. Epub 2012 Dec 20. Blood. 2013. PMID: 23264595 Free PMC article. - Mouse models of MLL leukemia: recapitulating the human disease.
Milne TA. Milne TA. Blood. 2017 Apr 20;129(16):2217-2223. doi: 10.1182/blood-2016-10-691428. Epub 2017 Feb 8. Blood. 2017. PMID: 28179274 Free PMC article. Review. - Insights from clinical studies into the role of the MLL gene in infant and childhood leukemia.
Chowdhury T, Brady HJ. Chowdhury T, et al. Blood Cells Mol Dis. 2008 Mar-Apr;40(2):192-9. doi: 10.1016/j.bcmd.2007.07.005. Epub 2007 Oct 1. Blood Cells Mol Dis. 2008. PMID: 17905612 Review.
Cited by
- Epigenetic therapy restores normal hematopoiesis in a zebrafish model of NUP98-HOXA9-induced myeloid disease.
Deveau AP, Forrester AM, Coombs AJ, Wagner GS, Grabher C, Chute IC, Léger D, Mingay M, Alexe G, Rajan V, Liwski R, Hirst M, Steigmaier K, Lewis SM, Look AT, Berman JN. Deveau AP, et al. Leukemia. 2015 Oct;29(10):2086-97. doi: 10.1038/leu.2015.126. Epub 2015 May 28. Leukemia. 2015. PMID: 26017032 - Integration of Transcriptomic Features to Improve Prognosis Prediction of Pediatric Acute Myeloid Leukemia With KMT2A Rearrangement.
Li J, Zong S, Wan Y, Ruan M, Zhang L, Yang W, Chen X, Zou Y, Chen Y, Guo Y, Wu P, Zhang Y, Zhu X. Li J, et al. Hemasphere. 2023 Nov 22;7(12):e979. doi: 10.1097/HS9.0000000000000979. eCollection 2023 Dec. Hemasphere. 2023. PMID: 38026790 Free PMC article. - Menin as a hub controlling mixed lineage leukemia.
Thiel AT, Huang J, Lei M, Hua X. Thiel AT, et al. Bioessays. 2012 Sep;34(9):771-80. doi: 10.1002/bies.201200007. Epub 2012 Jul 24. Bioessays. 2012. PMID: 22829075 Free PMC article. Review. - Interaction of retinoic acid and scl controls primitive blood development.
de Jong JL, Davidson AJ, Wang Y, Palis J, Opara P, Pugach E, Daley GQ, Zon LI. de Jong JL, et al. Blood. 2010 Jul 15;116(2):201-9. doi: 10.1182/blood-2009-10-249557. Epub 2010 Apr 21. Blood. 2010. PMID: 20410509 Free PMC article. - The Role of the HOXA Gene Family in Acute Myeloid Leukemia.
Chen SL, Qin ZY, Hu F, Wang Y, Dai YJ, Liang Y. Chen SL, et al. Genes (Basel). 2019 Aug 16;10(8):621. doi: 10.3390/genes10080621. Genes (Basel). 2019. PMID: 31426381 Free PMC article.
References
- Chen CS, Hilden JM, Frestedt J, et al. The chromosome 4q21 gene (AF-4/FEL) is widely expressed in normal tissues and shows breakpoint diversity in t(4;11)(q21;q23) acute leukemia. Blood. 1993;82:1080–1085. - PubMed
- Janssen JW, Ludwig WD, Borkhardt A, et al. Pre-pre-B acute lymphoblastic leukemia: high frequency of alternatively spliced ALL1-AF4 transcripts and absence of minimal residual disease during complete remission. Blood. 1994;84:3835–3842. - PubMed
- Kaneko Y, Shikano T, Maseki N, et al. Clinical characteristics of infant acute leukemia with or without 11q23 translocations. Leukemia. 1988;2:672–676. - PubMed
- Borkhardt A, Wuchter C, Viehmann S, et al. Infant acute lymphoblastic leukemia: combined cytogenetic, immunophenotypical and molecular analysis of 77 cases. Leukemia. 2002;16:1685–1690. - PubMed
- Pui CH, Behm FG, Raimondi SC, et al. Secondary acute myeloid leukemia in children treated for acute lymphoid leukemia. N Engl J Med. 1989;321:136–142. - PubMed
Publication types
MeSH terms
Substances
LinkOut - more resources
Full Text Sources
Other Literature Sources
Medical
Molecular Biology Databases
Research Materials


