Sca-1 expression is required for efficient remodeling of the extracellular matrix during skeletal muscle regeneration - PubMed (original) (raw)
Sca-1 expression is required for efficient remodeling of the extracellular matrix during skeletal muscle regeneration
Kimberly A Kafadar et al. Dev Biol. 2009.
Abstract
Sca-1 (Stem Cell Antigen-1) is a member of the Ly-6 family proteins that functions in cell growth, differentiation, and self-renewal in multiple tissues. In skeletal muscle Sca-1 negatively regulates myoblast proliferation and differentiation, and may function in the maintenance of progenitor cells. We investigated the role of Sca-1 in skeletal muscle regeneration and show here that Sca-1 expression is upregulated in a subset of myogenic cells upon muscle injury. We demonstrate that extract from crushed muscle upregulates Sca-1 expression in myoblasts in vitro, and that this effect is reversible and independent of cell proliferation. Sca-1(-/-) mice exhibit defects in muscle regeneration, with the development of fibrosis following injury. Sca-1(-/-) muscle displays reduced activity of matrix metalloproteinases, critical regulators of extracellular matrix remodeling. Interestingly, we show that the number of satellite cells is similar in wild-type and Sca-1(-/-) muscle, suggesting that in satellite cells Sca-1 does not play a role in self-renewal. We hypothesize that Sca-1 upregulates, directly or indirectly, the activity of matrix metalloproteinases, leading to matrix breakdown and efficient muscle regeneration. Further elucidation of the role of Sca-1 in matrix remodeling may aid in the development of novel therapeutic strategies for the treatment of fibrotic diseases.
Figures
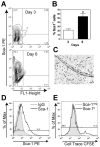
Figure 1. Sca-1 is upregulated in myofiber explant cultures
(A) Single myofibers were isolated from Myf5-nLacZ mice and cultured for 3 or 6 days, after which the mononucleated cells were isolated and immunostained with a PE-conjugated Sca-1 antibody and Sca-1 expression analyzed by flow cytometry. Representative flow plots are shown. (B) Quantitation of the increase in Sca-1+ cells over time. The percentage of Sca-1+ cells is 2.5 fold greater at 6 days compared to 3 days. Data are mean ± SE from 3 independent experiments; *p<0.05. (C) For each experiment a subset of myofibers was stained with X-gal to assess the myogenic purity of the cultures. Only cultures with >95% Myf5+ cells were analyzed. Bar=60μm. (D) Representative histogram showing Sca-1 PE fluoresence in mononucleated cells derived from myofiber explant cultures incubated for 6 days. Sca-1neg (69%) and Sca-1hi (11.3%) were used analyzed further for Cell Trace CFSE retention. (E) Representative Cell Trace CFSE profile of Sca-1neg (grey line) and Sca-1hi (black line) cells.
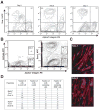
Figure 2. Sca-1+ myogenic cells are increased during regeneration
(A) Mononucleated cells were isolated from regenerating muscle of C57/B6 mice 0, 2, or 3 days post injury and immunostained with antibodies to CD31 and CD45 (FITC), Sca-1 (APC), and alpha-7-integrin (PE). Cells negative for CD31 and CD45 were analyzed for Sca-1 and alpha-7-integrin expression. See Figure S1 for gating strategy and controls. (A) Analysis of Sca-1 expression in alpha-7-integrin+ cells during regeneration. At day 0, very few alpha-7-integrin+ cells express Sca-1. Two days post-injury, this population has increased. After a further 24 hours, the percentage of Sca-1+alpha-7-integrin+ cells has returned to baseline. Representative flow plots are shown. n=3. (B) Two days after injury, mononucleated cells were isolated from the tibialis anterior muscles of C57/B6 mice and immunostained as above. Alpha-7-integrin+Sca-1+ (gate A) cells and alpha-7-integrin+Sca-1- (gate B) cells were sorted and used for limited dilution analysis. (C) Cells sorted from gate A or gate B were seeded in 96 well plates at initial cell numbers from 1-100 with 30 or 60 replicate wells. After 3 weeks in culture in high serum media, cells were fixed and immunostained for MHC (red) to determine the myogenicity of cultures. The nuclei were visualized with Hoechst. (D) Results of limited dilution analysis show that alpha-7-integrin+Sca-1+ cells are capable of undergoing myogenesis.
Figure 3. Crushed muscle extract reversibly upregulates Sca-1 expression in primary myoblasts
(A) Crushed muscle extract (CME) was subjected to SDS-PAGE on a 4-15% gradient gel followed by coomassie blue staining. (B) Primary myoblasts were treated with vehicle or 200μg/mL CME for 24 hours. Cells were immunostained with a PE-conjugated Sca-1 antibody and Sca-1 expression analyzed by flow cytometry. Representative flow plots are shown. (C) Quantitation of the effects of CME on the number of Sca-1+ cells. Primary myoblasts were treated for 24 hours with vehicle or the indicated concentrations of CME and analyzed as in B. Treatment with 200μg/mL results in a 2.5 fold increase in the percentage of Sca-1+ cells relative to vehicle. (D) The effects of CME on Sca-1 expression are reversible. Primary myoblasts were treated with vehicle or 200μg/mL CME for 24 hours, after which the media was replaced and the cells were analyzed immediately or allowed to grow for a further 24 or 48 hours. Cells were analyzed as in B. Data are mean ± SE, n=3. * indicates significantly different from vehicle, p<0.05. For D, ** indicates significantly different from 0 hours, p<0.05.
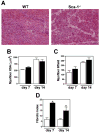
Figure 4. Sca-1 is required for efficient muscle regeneration following injury
(A) Regeneration was induced in the gastrocnemius muscles of WT and Sca-1-/- mice by BaCl2 injection. Seven and 14 days following injury, muscles were collected, and sections stained with hematoxylin and eosin for analysis. Representative sections are shown. Bar=60 μm. (B) No significant difference is observed in average myofiber XSA or in the number of myofibers per field (C) between genotypes. White bars, WT; black bars, Sca-1-/-. Data are mean ± SE. n=4 mice per genotype. (D) Sca-1-/- mice exhibit a 3.5 fold increase in the fibrotic index 7 days post injury. This increase persists at 14 days following BaCl2 injection (2.2 fold). Data are mean ± SE; n=4 mice per genotype, per timepoint. Statistical analysis was performed using 2-way analysis of variance. * p<0.001.
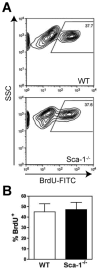
Figure 5. Absence of Sca-1 does not result in changes in myoblast proliferation during regeneration
Regeneration was induced in the tibialis anterior muscles of WT and Sca-1-/- mice by notexin injection. BrdU was administered intraperitoneally each day following damage. Muscles were harvested 3 days post-injury to assess the percentage of BrdU+ myoblasts by flow cytometry. CD31- CD45- alpha-7-integrin+ cells were immunostained with a FITC-conjugated antibody to BrdU. (A) Representative flow plots are shown. (B) Quantitation of BrdU+ myogenic cells in WT and Sca-1-/- during regeneration. No significant difference was observed between genotypes. Isotype controls were used to determine proper gating. WT n=5; Sca-1-/- n=6.
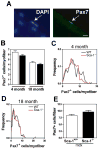
Figure 6. Sca-1-/- mice do not exhibit significant differences in satellite cell numbers
Individual myofibers were isolated from the gastrocnemius muscles of WT and Sca-1-/-mice, fixed immediately upon plating, and immunostained with an antibody to Pax7 to identify satellite cells. DAPI was used to visualize nuclei. (A) Representative image of a Pax7+ cell is shown. Bar=10μm. (B) No significant difference in average satellite cell number per myofiber exists between WT and Sca-1-/- mice at either 4 months or 18 months. 4 month myofiber n; WT=157, Sca-1-/-=150. 18 month myofiber n; WT=143, Sca-1-/-=128. (C,D) Frequency distribution of satellite cell number in 4 and 18 month Sca-1-/- and WT gastrocnemius muscles. (E) Repeated rounds of degeneration and regeneration do not result in a difference in satellite cell number in mdxSca-1-/- relative to mdxSca-1+/+. Individual gastrocnemius myofibers were isolated from 2-3 month old mice of both genotypes and treated as in (A). Myofiber n: mdxSca-1+/+=119; mdxSca-1-/-=95.
Figure 7. Sca-1-/- mice have reduced MMP activity
(A) Muscles were collected from WT and Sca-1-/- mice 0, 2, 3, and 5 days after BaCl2 injection. Muscles were homogenized, and extracts incubated with 10μM fluorogenic peptide substrate I at 37°C for 2 hours. Readings were taken every 10 minutes. Data are displayed as rate of RFU change/mg protein. n=3 mice for each timepoint. Statistical analysis was performed using 2-way analysis of variance. *p<0.008. (B) The difference in MMP activity between WT and Sca-1-/- muscle is at least partly due to reduced MMP activity in Sca-1-/- myoblasts. Conditioned media were collected from WT and Sca-1-/- myoblasts and incubated for 1 hour with 20μM fluorogenic peptide substrate I. Fold change in RFU in Sca-1-/- myoblasts is shown. RFU was normalized to cell number at the time of media collection. n=3; p<0.05. (C) WT and Sca-1-/- myoblasts were infected with the indicated retrovirus (RV), and Sca-1 levels determined by flow cytometry. Representative histograms are shown. (D) Overexpression of Sca-1 in Sca-1-/- myoblasts restores MMP activity to WT levels. Conditioned media were collected and analyzed for MMP activity as in (B). n=3: p=0.03.
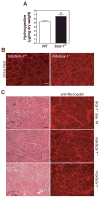
Figure 8. Sca-1-/- muscle displays increased levels of collagen and fibronectin
(A) Regeneration was induced in the gastrocnemius muscles of WT and Sca-1-/- mice by BaCl2 injection. Muscles were collected 7 days following injury and subjected to hydroxyproline analysis. Sca-1-/- muscle exhibits a 20% increase in hydroxyproline content. Hydroxyproline content normalized to dry muscle weight. n=4; p=0.03. (B) Gastrocnemius muscles from mdxSca-1-/- mice also exhibit increased collagen content compared to mdxSca-1+/+ mice. Muscle sections were stained with Sirius Red to detect collagen. Four mice of each genotype (aged 6-8 months) were analyzed. Representative images are shown. (C) The fibrous deposits observed in Sca-1-/- regenerating muscle also contain fibronectin. Sections from regenerating gastrocnemius muscles were isolated and immunostained with an antibody to fibronectin. mdxSca-1-/- muscle displays greater fibronectin deposits than mdxSca-1+/+ muscle. Three to four mice of each genotype were analyzed. Representative images are shown. Bar=60μm.
Similar articles
- Stem cell antigen-1 regulates the tempo of muscle repair through effects on proliferation of alpha7 integrin-expressing myoblasts.
Epting CL, López JE, Pedersen A, Brown C, Spitz P, Ursell PC, Bernstein HS. Epting CL, et al. Exp Cell Res. 2008 Mar 10;314(5):1125-35. doi: 10.1016/j.yexcr.2007.11.010. Epub 2007 Nov 19. Exp Cell Res. 2008. PMID: 18073129 Free PMC article. - Sca-1 is negatively regulated by TGF-beta1 in myogenic cells.
Long KK, Montano M, Pavlath GK. Long KK, et al. FASEB J. 2011 Apr;25(4):1156-65. doi: 10.1096/fj.10-170308. Epub 2010 Dec 14. FASEB J. 2011. PMID: 21156809 Free PMC article. - Sca-1 negatively regulates proliferation and differentiation of muscle cells.
Mitchell PO, Mills T, O'Connor RS, Kline ER, Graubert T, Dzierzak E, Pavlath GK. Mitchell PO, et al. Dev Biol. 2005 Jul 1;283(1):240-52. doi: 10.1016/j.ydbio.2005.04.016. Dev Biol. 2005. PMID: 15901485 - Role of matrix metalloproteinases in skeletal muscle: migration, differentiation, regeneration and fibrosis.
Chen X, Li Y. Chen X, et al. Cell Adh Migr. 2009 Oct-Dec;3(4):337-41. doi: 10.4161/cam.3.4.9338. Epub 2009 Oct 24. Cell Adh Migr. 2009. PMID: 19667757 Free PMC article. Review. - Myogenic cellular transplantation and regeneration: sorting through progenitor heterogeneity.
Jankowski RJ, Huard J. Jankowski RJ, et al. Panminerva Med. 2004 Mar;46(1):81-91. Panminerva Med. 2004. PMID: 15238884 Review.
Cited by
- FACS-isolation and Culture of Fibro-Adipogenic Progenitors and Muscle Stem Cells from Unperturbed and Injured Mouse Skeletal Muscle.
Riparini G, Simone JM, Sartorelli V. Riparini G, et al. J Vis Exp. 2022 Jun 8;(184):10.3791/63983. doi: 10.3791/63983. J Vis Exp. 2022. PMID: 35758697 Free PMC article. - Malaria abrogates O'nyong-nyong virus pathologies by restricting virus infection in nonimmune cells.
Torres-Ruesta A, Teo TH, Chan YH, Amrun SN, Yeo NK, Lee CY, Nguee SY, Tay MZ, Nosten F, Fong SW, Lum FM, Carissimo G, Renia L, Ng LF. Torres-Ruesta A, et al. Life Sci Alliance. 2022 Jan 17;5(4):e202101272. doi: 10.26508/lsa.202101272. Print 2022 Apr. Life Sci Alliance. 2022. PMID: 35039441 Free PMC article. - A Leptin Receptor Antagonist Attenuates Adipose Tissue Browning and Muscle Wasting in Infantile Nephropathic Cystinosis-Associated Cachexia.
Gonzalez A, Cheung WW, Perens EA, Oliveira EA, Gertler A, Mak RH. Gonzalez A, et al. Cells. 2021 Jul 31;10(8):1954. doi: 10.3390/cells10081954. Cells. 2021. PMID: 34440723 Free PMC article. - Targeting interleukin-1 for reversing fat browning and muscle wasting in infantile nephropathic cystinosis.
Cheung WW, Hao S, Zheng R, Wang Z, Gonzalez A, Zhou P, Hoffman HM, Mak RH. Cheung WW, et al. J Cachexia Sarcopenia Muscle. 2021 Oct;12(5):1296-1311. doi: 10.1002/jcsm.12744. Epub 2021 Jun 30. J Cachexia Sarcopenia Muscle. 2021. PMID: 34196133 Free PMC article. - Sca1+ Progenitor Cells (Ex vivo) Exhibits Differential Proteomic Signatures From the Culture Adapted Sca1+ Cells (In vitro), Both Isolated From Murine Skeletal Muscle Tissue.
Kapoor S, Subba P, Shenoy P S, Bose B. Kapoor S, et al. Stem Cell Rev Rep. 2021 Oct;17(5):1754-1767. doi: 10.1007/s12015-021-10134-w. Epub 2021 Mar 19. Stem Cell Rev Rep. 2021. PMID: 33742350
References
- Allen RE, Sheehan SM, Taylor RG, Kendall TL, Rice GM. Hepatocyte growth factor activates quiescent skeletal muscle satellite cells in vitro. Journal Of Cellular Physiology. 1995;165:307–12. - PubMed
- Badylak SF. The extracellular matrix as a scaffold for tissue reconstruction. Semin Cell Dev Biol. 2002;13:377–83. - PubMed
- Bamezai A, Palliser D, Berezovskaya A, McGrew J, Higgins K, Lacy E, Rock KL. Regulated expression of Ly-6A.2 is important for T cell development. J Immunol. 1995;154:4233–9. - PubMed
Publication types
MeSH terms
Substances
Grants and funding
- F32 AR052267-02/AR/NIAMS NIH HHS/United States
- R01 AR051372-04/AR/NIAMS NIH HHS/United States
- R01 AR051372/AR/NIAMS NIH HHS/United States
- R01 AR051372-02/AR/NIAMS NIH HHS/United States
- R01 AR051372-01A1/AR/NIAMS NIH HHS/United States
- R01 AR051372-03/AR/NIAMS NIH HHS/United States
- F32 AR052267/AR/NIAMS NIH HHS/United States
- F32 AR052267-03/AR/NIAMS NIH HHS/United States
- AR051372/AR/NIAMS NIH HHS/United States
- F32 AR052267-01/AR/NIAMS NIH HHS/United States
LinkOut - more resources
Full Text Sources
Molecular Biology Databases
Research Materials
