An empirical framework for binary interactome mapping - PubMed (original) (raw)
doi: 10.1038/nmeth.1280. Epub 2008 Dec 7.
Jean-François Rual, Alexei Vazquez, Ulrich Stelzl, Irma Lemmens, Tomoko Hirozane-Kishikawa, Tong Hao, Martina Zenkner, Xiaofeng Xin, Kwang-Il Goh, Muhammed A Yildirim, Nicolas Simonis, Kathrin Heinzmann, Fana Gebreab, Julie M Sahalie, Sebiha Cevik, Christophe Simon, Anne-Sophie de Smet, Elizabeth Dann, Alex Smolyar, Arunachalam Vinayagam, Haiyuan Yu, David Szeto, Heather Borick, Amélie Dricot, Niels Klitgord, Ryan R Murray, Chenwei Lin, Maciej Lalowski, Jan Timm, Kirstin Rau, Charles Boone, Pascal Braun, Michael E Cusick, Frederick P Roth, David E Hill, Jan Tavernier, Erich E Wanker, Albert-László Barabási, Marc Vidal
Affiliations
- PMID: 19060904
- PMCID: PMC2872561
- DOI: 10.1038/nmeth.1280
An empirical framework for binary interactome mapping
Kavitha Venkatesan et al. Nat Methods. 2009 Jan.
Abstract
Several attempts have been made to systematically map protein-protein interaction, or 'interactome', networks. However, it remains difficult to assess the quality and coverage of existing data sets. Here we describe a framework that uses an empirically-based approach to rigorously dissect quality parameters of currently available human interactome maps. Our results indicate that high-throughput yeast two-hybrid (HT-Y2H) interactions for human proteins are more precise than literature-curated interactions supported by a single publication, suggesting that HT-Y2H is suitable to map a significant portion of the human interactome. We estimate that the human interactome contains approximately 130,000 binary interactions, most of which remain to be mapped. Similar to estimates of DNA sequence data quality and genome size early in the Human Genome Project, estimates of protein interaction data quality and interactome size are crucial to establish the magnitude of the task of comprehensive human interactome mapping and to elucidate a path toward this goal.
Figures
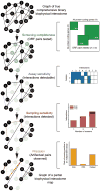
Figure 1. Conceptual framework for interactome mapping
The concepts of “screening completeness” (fraction of all pair-wise protein combinations tested), “assay sensitivity” (fraction of all biophysical interactions identifiable by a given assay), “sampling sensitivity” (fraction of all identifiable interactions that are detected in a single trial) and “precision” (fraction of pairs reported by a given assay that are true positives) can be estimated independently and combined to empirically estimate the size of binary interactomes. PRS: the set of positive reference set interactions; RRS: the random reference set. Solid black lines in a given network graph represent true biophysical interactions present in that network, dashed lines represent true biophysical interactions missing in that network, and solid colored lines represent biophysical artifactual pairs present in that network.
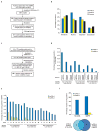
Figure 2. Assay sensitivity and background positive rate of binary interactome mapping assays
(a) How positive reference set interactions were chosen from among the interactions available in the curated literature of low-throughput experimentally derived interactions (LC). (b) How random reference set pairs were chosen from among the possible pairs in our human ORFeome v1.1 clone collection. (c) Distribution of cellular location of proteins making up the positive and random reference sets. (d) Assay sensitivity (fraction of hsPRS-v1 pairs scoring positive) and background positive rate (fraction of hsRRS-v1 pairs scoring positive) of the Y2H-CCSB assay based on varying experimental and scoring conditions, including the use of an alternate protocol (Supplementary Methods). We did not use the results of testing the hsRRS-v1 pairs here to estimate the false discovery rate of the Y2H-CCSB assay due to limited sample size. (e) Assay sensitivity and background positive rate of the MAPPIT assay upon varying experiment-to-control-ratio (ECR) scores (Supplementary Methods). (f) Upper panel: assay sensitivity and background positive rate of Y2H-CCSB and MAPPIT under the specific experimental conditions used (Supplementary Methods). For Y2H-CCSB, the fraction of hsPRS-v1 pairs scoring positive in at least one configuration and in both pair-wise mating experiments is depicted. This condition reflects the assay sensitivity of the specific experimental and scoring conditions of Y2H-CCSB used to generate CCSB-HI1. Lower panel: Venn diagram of hsPRS-v1 pairs scoring positive in the two assays. (g) Results of testing each hsPRS-v1 pair and each hsRRS-v1 pair using Y2H-CCSB and MAPPIT. Blue or yellow shaded squares represent protein pairs scored positive by a given assay.
Figure 3. Precision and sampling sensitivity in interactome datasets
(a) Comparison of interactome datasets by comparing the rate of observing a positive by MAPPIT given a positive in the dataset. (b) Interactome datasets were further compared after removing various biases by considering interactions originally derived using full-length (FL) proteins and using Y2H assays. (c) Precision of each tested dataset computed by accounting for the rate of detecting hsRRS-v1 pairs and Y2H-supported hsPRS-v1 pairs by MAPPIT in b. Error bars represent estimated standard deviation of the mean based on a Monte Carlo simulation of scores observed in a given assay. (d and e) Sampling sensitivity and Y2H-CCSB repeat screens. Bars filled with white represent protein pairs uncovered in only one screen and progressively dark shades of blue represent protein pairs reported in increasing number of multiple screens. (d) Data observed in Y2H-CCSB repeat screens indicating the total number of positive pairs reported after one, two, three or four screens. (e) Predicted saturation curve of the number of uncovered interactions against the number of screens for Y2H-CCSB after modeling the data in d and assuming a single isoform per gene in the respective tested spaces.
Figure 4. Correlation of interacting pairs for shared functional annotation
Correlation of interacting pairs in CCSB-HI1 and MDC-HI1 interactome maps for specific shared Gene Ontology functional annotations. _P_-values indicate the probability of observing such a correlation by chance (compare black bars to white bars) computed using Fisher’s exact test. Analysis was performed on MDC-HI1 and CCSB-HI1 interactions reported using full-length ORFs.
Similar articles
- High-quality binary protein interaction map of the yeast interactome network.
Yu H, Braun P, Yildirim MA, Lemmens I, Venkatesan K, Sahalie J, Hirozane-Kishikawa T, Gebreab F, Li N, Simonis N, Hao T, Rual JF, Dricot A, Vazquez A, Murray RR, Simon C, Tardivo L, Tam S, Svrzikapa N, Fan C, de Smet AS, Motyl A, Hudson ME, Park J, Xin X, Cusick ME, Moore T, Boone C, Snyder M, Roth FP, Barabási AL, Tavernier J, Hill DE, Vidal M. Yu H, et al. Science. 2008 Oct 3;322(5898):104-10. doi: 10.1126/science.1158684. Epub 2008 Aug 21. Science. 2008. PMID: 18719252 Free PMC article. - Empirically controlled mapping of the Caenorhabditis elegans protein-protein interactome network.
Simonis N, Rual JF, Carvunis AR, Tasan M, Lemmens I, Hirozane-Kishikawa T, Hao T, Sahalie JM, Venkatesan K, Gebreab F, Cevik S, Klitgord N, Fan C, Braun P, Li N, Ayivi-Guedehoussou N, Dann E, Bertin N, Szeto D, Dricot A, Yildirim MA, Lin C, de Smet AS, Kao HL, Simon C, Smolyar A, Ahn JS, Tewari M, Boxem M, Milstein S, Yu H, Dreze M, Vandenhaute J, Gunsalus KC, Cusick ME, Hill DE, Tavernier J, Roth FP, Vidal M. Simonis N, et al. Nat Methods. 2009 Jan;6(1):47-54. doi: 10.1038/nmeth.1279. Nat Methods. 2009. PMID: 19123269 Free PMC article. - New insights into protein-protein interaction data lead to increased estimates of the S. cerevisiae interactome size.
Sambourg L, Thierry-Mieg N. Sambourg L, et al. BMC Bioinformatics. 2010 Dec 21;11:605. doi: 10.1186/1471-2105-11-605. BMC Bioinformatics. 2010. PMID: 21176124 Free PMC article. - Interactome mapping for analysis of complex phenotypes: insights from benchmarking binary interaction assays.
Braun P. Braun P. Proteomics. 2012 May;12(10):1499-518. doi: 10.1002/pmic.201100598. Proteomics. 2012. PMID: 22589225 Review. - Charting plant interactomes: possibilities and challenges.
Morsy M, Gouthu S, Orchard S, Thorneycroft D, Harper JF, Mittler R, Cushman JC. Morsy M, et al. Trends Plant Sci. 2008 Apr;13(4):183-91. doi: 10.1016/j.tplants.2008.01.006. Epub 2008 Mar 7. Trends Plant Sci. 2008. PMID: 18329319 Review.
Cited by
- Computational and informatics strategies for identification of specific protein interaction partners in affinity purification mass spectrometry experiments.
Nesvizhskii AI. Nesvizhskii AI. Proteomics. 2012 May;12(10):1639-55. doi: 10.1002/pmic.201100537. Proteomics. 2012. PMID: 22611043 Free PMC article. Review. - The HPV E2-Host Protein-Protein Interactions: A Complex Hijacking of the Cellular Network.
Muller M, Demeret C. Muller M, et al. Open Virol J. 2012;6:173-89. doi: 10.2174/1874357901206010173. Epub 2012 Dec 28. Open Virol J. 2012. PMID: 23341853 Free PMC article. - Symmetry of Charge Partitioning in Collisional and UV Photon-Induced Dissociation of Protein Assemblies.
Tamara S, Dyachenko A, Fort KL, Makarov AA, Scheltema RA, Heck AJ. Tamara S, et al. J Am Chem Soc. 2016 Aug 31;138(34):10860-8. doi: 10.1021/jacs.6b05147. Epub 2016 Aug 16. J Am Chem Soc. 2016. PMID: 27480281 Free PMC article. - Endophenotype Network Models: Common Core of Complex Diseases.
Ghiassian SD, Menche J, Chasman DI, Giulianini F, Wang R, Ricchiuto P, Aikawa M, Iwata H, Müller C, Zeller T, Sharma A, Wild P, Lackner K, Singh S, Ridker PM, Blankenberg S, Barabási AL, Loscalzo J. Ghiassian SD, et al. Sci Rep. 2016 Jun 9;6:27414. doi: 10.1038/srep27414. Sci Rep. 2016. PMID: 27278246 Free PMC article. - Normalized lmQCM: An Algorithm for Detecting Weak Quasi-Cliques in Weighted Graph with Applications in Gene Co-Expression Module Discovery in Cancers.
Zhang J, Huang K. Zhang J, et al. Cancer Inform. 2016 Jul 24;13(Suppl 3):137-46. doi: 10.4137/CIN.S14021. eCollection 2014. Cancer Inform. 2016. PMID: 27486298 Free PMC article.
References
- Vidal M. Interactome modeling. FEBS Lett. 2005;579:1834–1838. - PubMed
- Rual JF, et al. Towards a proteome-scale map of the human protein-protein interaction network. Nature. 2005;437:1173–1178. - PubMed
- Stelzl U, et al. A human protein-protein interaction network: a resource for annotating the proteome. Cell. 2005;122:957–968. - PubMed
Publication types
MeSH terms
Substances
Grants and funding
- U01 CA105423/CA/NCI NIH HHS/United States
- 5U01 CA 105423/CA/NCI NIH HHS/United States
- U54 CA112952/CA/NCI NIH HHS/United States
- U01 AI 070499-01/AI/NIAID NIH HHS/United States
- P50 HG004233/HG/NHGRI NIH HHS/United States
- 5U54 CA 112952/CA/NCI NIH HHS/United States
- P50 HG004233-03/HG/NHGRI NIH HHS/United States
- 2R01 HG 001715/HG/NHGRI NIH HHS/United States
- 5P50 HG 004233/HG/NHGRI NIH HHS/United States
- T32 CA009361/CA/NCI NIH HHS/United States
- T32 CA 09361/CA/NCI NIH HHS/United States
- U56 CA113004/CA/NCI NIH HHS/United States
- R01 HG001715/HG/NHGRI NIH HHS/United States
- R01 HG001715-12/HG/NHGRI NIH HHS/United States
- U56 CA 113004/CA/NCI NIH HHS/United States
LinkOut - more resources
Full Text Sources
Other Literature Sources
Molecular Biology Databases


