Genome-wide detection and analysis of hippocampus core promoters using DeepCAGE - PubMed (original) (raw)
doi: 10.1101/gr.084541.108. Epub 2008 Dec 11.
Giovanni Pascarella, Alistair Chalk, Norihiro Maeda, Miki Kojima, Chika Kawazu, Mitsuyoshi Murata, Hiromi Nishiyori, Dejan Lazarevic, Dario Motti, Troels Torben Marstrand, Man-Hung Eric Tang, Xiaobei Zhao, Anders Krogh, Ole Winther, Takahiro Arakawa, Jun Kawai, Christine Wells, Carsten Daub, Matthias Harbers, Yoshihide Hayashizaki, Stefano Gustincich, Albin Sandelin, Piero Carninci
Affiliations
- PMID: 19074369
- PMCID: PMC2652207
- DOI: 10.1101/gr.084541.108
Genome-wide detection and analysis of hippocampus core promoters using DeepCAGE
Eivind Valen et al. Genome Res. 2009 Feb.
Abstract
Finding and characterizing mRNAs, their transcription start sites (TSS), and their associated promoters is a major focus in post-genome biology. Mammalian cells have at least 5-10 magnitudes more TSS than previously believed, and deeper sequencing is necessary to detect all active promoters in a given tissue. Here, we present a new method for high-throughput sequencing of 5' cDNA tags-DeepCAGE: merging the Cap Analysis of Gene Expression method with ultra-high-throughput sequence technology. We apply DeepCAGE to characterize 1.4 million sequenced TSS from mouse hippocampus and reveal a wealth of novel core promoters that are preferentially used in hippocampus: This is the most comprehensive promoter data set for any tissue to date. Using these data, we present evidence indicating a key role for the Arnt2 transcription factor in hippocampus gene regulation. DeepCAGE can also detect promoters used only in a small subset of cells within the complex tissue.
Figures
Figure 1.
Preparation of DeepCAGE cDNA libraries. cDNA is produced with reverse transcriptase using random priming to maximize chances to reach the cap sites and to include non-polyadenylated RNAs. The cap site is biotinylated, followed by cleavage of single-strand RNA (incomplete cDNA). After recovery of the cDNA, a linker is ligated on the 5′-end, which carries the MmeI restriction site, which cleaves 20/21 nt inside the 5′-end of the cDNA. After a second linker ligation and PCR amplification, restricted digested tags are purified and finally concatenated together with the “454” linkers A and B. (SMB) Streptavidin-coated magnetic beads; (B) biotin.
Figure 2.
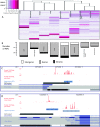
Exploration and validation of identified core promoters. (A) Exploration of tissue usage in all core promoters having more than 30 tags per million using hierarchical clustering, with CAGE tag expression data from the actual core promoters. Preferential usage for a certain tissue (fraction of tags belonging to the tissue in question) is color-coded as shown in the legend. Rows represent individual promoters (the row dendrogram is omitted because of the large number of rows), while columns are the different tissues. (B) Number of core promoters used preferentially in just one tissue (PEPs, as defined in Methods) and the locations of these core promoters relative to known genes. (C,D) Examples of discovery and validation of novel intergenic promoters expressed preferentially in hippocampus. All hippocampus tags are shown as red bar plots (one for each strand). Clusters of tags that are preferentially expressed in hippocampus (hippocampus PEPs) are shown as blue fragments where the color intensity is proportional to the fraction of tags in the cluster from hippocampus vs. other tissues. RACE products are in black. (C) The validation of a proximal alternative promoter to the Bai3 gene. (D) The validation of a promoter upstream of the Arpc5 gene but on the opposite strand; RACE as well as a human orthologous transcript show that this is a distal upstream promoter for the Rgl1 gene.
Figure 3.
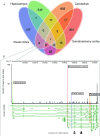
Alternative promoters preferentially expressed in different brain tissues. (A) The Venn diagram shows the number of genes having at least one preferentially expressed promoter (PEP) from any of the four sampled brain tissues, or any combination PEPs of the four tissues. For example, there are 15 genes that have at least one hippocampus PEP and one cerebellum PEP. (B) The Dlgap1 gene has four PEPs, one from each brain tissue. All of these are overlapping known 5′-ends inferred by cDNAs. There are five 14-amino-acid-long repeats in the N-terminal end of the corresponding protein that affects the ability to interact with other proteins. Repeats are indicated as triangles. Note that the cerebellum PEP is downstream from these and will give a protein that lacks these repeats.
Figure 4.
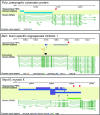
Examples of changes of domain content for genes by use of hippocampus PEPs. Hippocampus preferentially expressed promoter (PEP) locations are shown as red triangles. Locations of predicted protein domains are shown as colored blocks (note that domains spanning more than exons are extended over the intron(s). In all of these cases, at least one domain is upstream of the PEP, which means that this domain is not included in the isoform expressed in hippocampus. Known cDNA locations are shown below: transcription is right-to-left. BAI1 is a membrane protein whose N-terminal domain is extracellular, with a transmembrane region just downstream from the GPS domain (data not shown). The extracellular part can be cleaved off at the GPS domain, releasing a tumor-suppressing peptide; however, the hippocampus PEP is just downstream from the GPS domain, presumably giving a BAI1 variant that is attached to the membrane but without the extracellular domains, which lack the tumor-suppression capability (Kaur et al. 2005). Similarly, the PEPs in Myo10 confirm a previous study showing the neuronal expression of an isoform lacking the Myosin head domain (Sousa et al. 2006). In Pclo, the zf-piccolo domain cannot be included when using the hippocampus PEP.
Figure 5.
Transcription factor genes with preferential expression in hippocampus. (A) The relation between expression strength (number of hippocampus CAGE tags/million) vs. the “tissue specificity” (fraction of hippocampus tags vs. all brain tags, normalized for library size) of all known transcription factor genes. Note that only a few transcription factor genes are both highly expressed in and highly specific for hippocampus. For example, both in situ hybridization and CAGE data show that the Nr3c2 gene (the mineralocorticoid receptor) is not highly expressed in brain, but almost exclusively expressed in hippocampus, while the Aes gene is expressed in the whole brain with a preference for hippocampus. (C-H and Aes, right) In situ images for some of these factors. (B) In situ hybridization images (Lein et al. 2007) showing the hippocampus expression of the Arnt2 gene. The three images show the Allen reference atlas, the ISH in situ image, and corresponding expression heatmaps.
Figure 6.
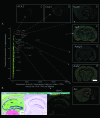
CAGE identifies promoter activity from small subpopulations of hippocampal cells. Examples of correspondence between CAGE tags and signal detected by in situ hybridization, ordered from relatively high expression (from the top left quadrant), expressed as the number of CAGE tags from hippocampus mapping to the gene, to low expression (the lowest right quadrant). On the left the original in situ signal is shown; on the right the in situ hybridization signal is quantified with pseudo-colors where red corresponds to high expression. In situ hybridization images were obtained from the Allen Brain Institute (Lein et al. 2007). Notice that the signal or tags corresponding to less than 5/1.4 × 106 mapped tags correspond to RNAs that are expressed only in a specific subset of cells.
Similar articles
- Genome-wide analysis of core promoter structures in Schizosaccharomyces pombe with DeepCAGE.
Li H, Hou J, Bai L, Hu C, Tong P, Kang Y, Zhao X, Shao Z. Li H, et al. RNA Biol. 2015;12(5):525-37. doi: 10.1080/15476286.2015.1022704. RNA Biol. 2015. PMID: 25747261 Free PMC article. - Heterogeneity of Arabidopsis core promoters revealed by high-density TSS analysis.
Yamamoto YY, Yoshitsugu T, Sakurai T, Seki M, Shinozaki K, Obokata J. Yamamoto YY, et al. Plant J. 2009 Oct;60(2):350-62. doi: 10.1111/j.1365-313X.2009.03958.x. Epub 2009 Jun 29. Plant J. 2009. PMID: 19563441 - Methods for analyzing deep sequencing expression data: constructing the human and mouse promoterome with deepCAGE data.
Balwierz PJ, Carninci P, Daub CO, Kawai J, Hayashizaki Y, Van Belle W, Beisel C, van Nimwegen E. Balwierz PJ, et al. Genome Biol. 2009;10(7):R79. doi: 10.1186/gb-2009-10-7-r79. Epub 2009 Jul 22. Genome Biol. 2009. PMID: 19624849 Free PMC article. - Deep cap analysis gene expression (CAGE): genome-wide identification of promoters, quantification of their expression, and network inference.
de Hoon M, Hayashizaki Y. de Hoon M, et al. Biotechniques. 2008 Apr;44(5):627-8, 630, 632. doi: 10.2144/000112802. Biotechniques. 2008. PMID: 18474037 Review. - Computational analyses of eukaryotic promoters.
Zhang MQ. Zhang MQ. BMC Bioinformatics. 2007 Sep 27;8 Suppl 6(Suppl 6):S3. doi: 10.1186/1471-2105-8-S6-S3. BMC Bioinformatics. 2007. PMID: 17903284 Free PMC article. Review.
Cited by
- Identification of cis-elements and transcription factors regulating neuronal activity-dependent transcription of human BDNF gene.
Pruunsild P, Sepp M, Orav E, Koppel I, Timmusk T. Pruunsild P, et al. J Neurosci. 2011 Mar 2;31(9):3295-308. doi: 10.1523/JNEUROSCI.4540-10.2011. J Neurosci. 2011. PMID: 21368041 Free PMC article. - Differential regulation of non-protein coding RNAs from Prader-Willi Syndrome locus.
Galiveti CR, Raabe CA, Konthur Z, Rozhdestvensky TS. Galiveti CR, et al. Sci Rep. 2014 Sep 23;4:6445. doi: 10.1038/srep06445. Sci Rep. 2014. PMID: 25246219 Free PMC article. - Long Non-coding RNAs: Mechanisms, Experimental, and Computational Approaches in Identification, Characterization, and Their Biomarker Potential in Cancer.
Chowdhary A, Satagopam V, Schneider R. Chowdhary A, et al. Front Genet. 2021 Jul 1;12:649619. doi: 10.3389/fgene.2021.649619. eCollection 2021. Front Genet. 2021. PMID: 34276764 Free PMC article. Review. - RNA sequencing: advances, challenges and opportunities.
Ozsolak F, Milos PM. Ozsolak F, et al. Nat Rev Genet. 2011 Feb;12(2):87-98. doi: 10.1038/nrg2934. Epub 2010 Dec 30. Nat Rev Genet. 2011. PMID: 21191423 Free PMC article. Review. - Sequencing of first-strand cDNA library reveals full-length transcriptomes.
Agarwal S, Macfarlan TS, Sartor MA, Iwase S. Agarwal S, et al. Nat Commun. 2015 Jan 21;6:6002. doi: 10.1038/ncomms7002. Nat Commun. 2015. PMID: 25607527 Free PMC article.
References
- Bird C.M., Burgess N. The hippocampus and memory: Insights from spatial processing. Nat. Rev. Neurosci. 2008;9:182–194. - PubMed
- Carninci P., Shiraki T., Mizuno Y., Muramatsu M., Hayashizaki Y. Extra-long first-strand cDNA synthesis. Biotechniques. 2002;32:984–985. - PubMed
- Carninci P., Kasukawa T., Katayama S., Gough J., Frith M.C., Maeda N., Oyama R., Ravasi T., Lenhard B., Wells C., et al. The transcriptional landscape of the mammalian genome. Science. 2005;309:1559–1563. - PubMed
- Carninci P., Sandelin A., Lenhard B., Katayama S., Shimokawa K., Ponjavic J., Semple C.A., Taylor M.S., Engstrom P.G., Frith M.C., et al. Genome-wide analysis of mammalian promoter architecture and evolution. Nat. Genet. 2006;38:626–635. - PubMed
Publication types
MeSH terms
Substances
LinkOut - more resources
Full Text Sources
Other Literature Sources
Miscellaneous


