Circadian gene expression is resilient to large fluctuations in overall transcription rates - PubMed (original) (raw)
Circadian gene expression is resilient to large fluctuations in overall transcription rates
Charna Dibner et al. EMBO J. 2009.
Abstract
Mammalian circadian oscillators are considered to rely on transcription/translation feedback loops in clock gene expression. The major and essential loop involves the autorepression of cryptochrome (Cry1, Cry2) and period (Per1, Per2) genes. The rhythm-generating circuitry is functional in most cell types, including cultured fibroblasts. Using this system, we show that significant reduction in RNA polymerase II-dependent transcription did not abolish circadian oscillations, but surprisingly accelerated them. A similar period shortening was observed at reduced incubation temperatures in wild-type mouse fibroblasts, but not in cells lacking Per1. Our data suggest that mammalian circadian oscillators are resilient to large fluctuations in general transcription rates and temperature, and that PER1 has an important function in transcription and temperature compensation.
Figures
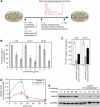
Figure 1
Reduction of RNA polymerase II-mediated transcription by sublethal concentrations of α-amanitin and actinomycin D. (A) Experimental design scheme. (B) [14C]Thymidine-prelabeled NIH3T3 cells were treated for 16 h with 0–5 μg/ml of α-amanitin and pulse-labeled with [3H]uridine for 60 min at the indicated time points. Transcription rates were calculated on a per DNA basis as described in Materials and methods. Pretreatment of NIH3T3 cells with 3 μg/ml of α-amanitin for 16 h reduced RNA synthesis to 58±13% relative to untreated control (_n_=5); with 5 μg/ml of α-amanitin to 36±6% (_n_=4; panel 0 h). At 24 h after α-amanitin removal, the relative transcription rates amounted to 42±14% (_n_=5) and 26±6% (_n_=4), respectively, for the two drug concentrations (panel 24 h), and 48 h after drug removal, they amounted to 81±24% (_n_=5) and 29±5% (_n_=4; panel 48 h), respectively. (C) Relative run-on transcription rates were determined for nuclei of NIH3T3 fibroblasts pretreated with 3 μg/ml of α-amanitin for 16 h or with 50 nM actinomycin D for 5 h. (D) Expression profiles of c-fos precursor RNA from untreated cells and cells pretreated with 3 μg/ml α-amanitin during 16 h. Cells were collected at the indicated time points after horse serum addition (time 0); transcripts were quantified as described in Materials and methods. (E) Western blot analysis of whole-cell extracts from untreated cells and cells pretreated with 3 μg/ml α-amanitin. The antibodies used recognize the RPB1 and the splicing factor U2AF65 (loading control).
Figure 2
Endogenous core clock genes oscillate with a lower circadian amplitude at reduced Pol II-dependent transcription rates. Expression profiles of Bmal1, _Rev-erb_α, Dbp, Per1 and Per2 mRNA from untreated cells and cells pretreated with 3 μg/ml α-amanitin for 16 h. The cells were collected at the indicated time points after the addition of horse serum (time 0). The relative mRNA levels were determined by qRT–PCR analysis and normalized to genomic DNA (see Materials and methods).
Figure 3
NIH3T3 circadian oscillators are functional at significantly reduced RNA polymerase II-dependent transcription rates. (A) NIH3T3 Bmal1-luc cells (grown to confluence) were incubated for 16 h in the presence of 0–5 μg/ml of α-amanitin. At time 0, cells were induced by dexamethasone, α-amanitin was removed and bioluminescence was recorded for 172 consecutive hours (left panel). Increasing doses of α-amanitin resulted in progressively shorter period lengths. The mean period lengths±s.d. determined in ‘n' repetitions in five independent experiments were 25.9±0.9, 25.5±0.3 and 23.6±1.1 h for 0, 1 and 3 μg/ml of α-amanitin, respectively; _n_=18; see middle panel. The magnitudes (maximal photon counts) decreased with increasing α-amanitin concentrations (right panel). Using bilateral _t_-test for statistical analysis, the following significance values were obtained for data sets from cells on 3 μg/ml of α-amanitin treatment compared with untreated samples: for period length change _P_=7 × 10⁻⁵; for magnitude _P_=0.01. (B) NIH3T3 Bmal1-luc cells were incubated for 5 h in the presence of 0–100 nM of actinomycin D. At time 0, cells were treated with dexamethasone, actinomycin D was washed away and bioluminescence was recorded for 186 h (left panel). Increasing doses of actinomycin D resulted in progressively shorter period length: 25.4±0.7, 24.5±0.9, 23.5±0.5 and 23.3±0.7 h for 0, 20, 50 and 100 nM of actinomycin D, respectively; _n_=5; see middle panel. The magnitudes were reduced by the drug treatment (right panel). The following significance values were obtained for data sets from cells on 50 nM of actinomycin D treatment compared with control: _P_=0.001; for magnitude _P_=0.018.
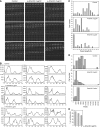
Figure 4
Individual α-amanitin-treated fibroblasts contain functional oscillators and have shorter period length. NIH3T3 Bmal1-luc fibroblasts (grown to confluence) were incubated for 16 h with DMEM+10% FCS containing 0, 3 or 5 μg/ml of α-amanitin. At time 0, cells were synchronized by dexamethasone and time-lapse photon-counting microscopy was performed for three consecutive days as described in Materials and methods (see Supplementary movies 1–3, respectively). (A) Time-lapse microscopy of circadian Bmal1-luc expression in three individual cells each for untreated cells and cells pretreated with 3 or 5 μg/ml of α-amanitin. (B) Bioluminescence intensity profiles of six representative cells for each condition after synchronization with dexamethasone. (C) Histogram of period length distribution from 50 cells (control or 3 μg/ml α-amanitin) and 26 cells for 5 μg/ml α-amanitin. Period length was obtained from the best fit function as described in Supplementary data. The mean period lengths were 26.8±2.7, 24.1±3.6 and 23.4±3.2 h, respectively, for 0, 3 and 5 μg/ml α-amanitin. (D) The signal intensity distribution (integrated pixels over the second peak) was calculated using the best fit function for 50 cells (control or 3 μg/ml α-amanitin) and 26 cells for 5 μg/ml α-amanitin. Mean sum intensities were 78 834.2±33 394, 41 347±18 097 and 37 806±10 130 pixels × h for 0, 3 and 5 μg/ml α-amanitin, respectively. ANOVA analysis of data sets presented in (C, D) against each other yielded the following values: _P_=2 × 10⁻¹⁰ for the period length values; _P_=7 × 10⁻⁷ for mean sum intensities. (E) Percentages of oscillating cells among untreated cells (_N_=60), cells pretreated with 3 μg/ml of α-amanitin (_N_=65) and 5 μg/ml of α-amanitin (_N_=40).
Figure 5
Transcription rates have mild effects on period length at reduced temperatures. (A) Bmal1-luc fibroblasts were synchronized with dexamethasone, placed into home-made precision incubators at temperatures ranging from 31 to 41°C, and bioluminescence cycles were recorded during 168 h. Of note, the period length progressively increases with elevated temperature. (B, C) Bioluminescence cycles from untreated and α-amanitin-treated (3 μg/ml) Bmal1-luc fibroblasts were recorded for 92 h at 33 or at 37°C. At 33°C, the α-amanitin-induced period shortening was less significant (23.21±0.42 versus 23.96±0.54 h) than at 37°C (23.52±0.82 versus 26.03±0.54 h). The following _P_-values were obtained for data sets compared with each other: period length from cells on 3 μg/ml of α-amanitin treatment compared with untreated samples at 37°C (B) _P_=0.001 and at 33°C (C) _P_=0.12.
Figure 6
Per1 influences the response of fibroblast oscillators to changes in global transcription rates and temperature. Skin tail primary fibroblasts from Per1KO/Per2∷luc mice were pretreated for 16 h with 3 μg/ml α-amanitin, or for 5 h with 50 nM actinomycin D, and compared with untreated cells. Note that the mean period lengths determined in five independent experiments (indicated in the graph) did not change dramatically in response to these drugs, but that the amplitude increased in actinomycin D-treated cells. (B) Raw data from experiment (A) was subjected to linear regression analysis: slopes indicated at Y axes were calculated for 542 time points representing 9 h. (C) Bioluminescence cycles produced by Per1KO/Per2∷luc mouse tail primary fibroblasts were recorded at different temperatures as described in the legend of Figure 5. The cells were oscillating with progressively shorter period at increasing temperatures. (D) Per2∷luc mouse tail fibroblasts (immortalized with an expression vector encoding SV40 virus large T antigen) were grown to confluence, synchronized with dexamethasone, placed into individual boxes preheated to temperatures varying from 29 to 39°C, and bioluminescence was recorded for 168 h. Note that period length gets progressively longer with temperature increase. (E) Period length from Per1KO cells (C) and their wild-type counterparts (D) are plotted against temperature and have the opposite trends. The following _P_-values were obtained for data sets compared with each other: period length from Per1KO cells on 3 μg/ml of α-amanitin treatment compared with untreated Per1KO samples (A, B) _P_=0.2; for actinomycin D treatment _P_=0.3; for period length change at 32°C in comparison to 39°C for P1KO cells _P_=0.1 (C); for wt _P_=0.03 (D), with the opposite trend.
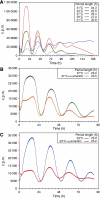
Figure 7
Period as a function of global transcription rates in common circadian oscillator models. The parameter ρ is a multiplicative factor that controls all transcription rates, ρ=1 corresponds to the published nominal parameter values. Two simple low-dimensional models (A, B) and two more detailed models (C, D) are shown. (A) The three species Gonze-Goldbeter delayed negative feedback model with a messenger (m), a cytoplasmic (C) and nuclear repressor (N) shows onset of oscillation at ρ=0.43 (Hopf bifurcation). Oscillations are kept when the transcription rate is raised by at least 20-fold. Period length initially rapidly increases with transcription, and then levels off at _T_∼34 h. The variation of the period with increased transcription ρ is positive around ρ=1. The period lengthens with increasing ρ around ρ=1. (B) A minimal two species relaxation (hysteresis-based) oscillator given by the equations for an activator (A) and a repressor (R):  with parameters _s_=0.064 [_A_]/h, d_A_=0.32/h, _f_=5.8 [_A_]/h, _e_=1.6 [_R_]−1/h, _k_=0.64 [_A_]−1/h and d_R_=0.15/h. Here, transcription and translation processes are taken together. The model has an infinite period bifurcation near ρ=0.27 and a Hopf bifurcation at ρ=2.2. The period shortens with increasing ρ around ρ=1. (C) The 16-dimensional mammalian model by Leloup and Goldbeter. With its standard parameters, this model has a very narrow range of oscillation around ρ=1 within ∼10% of variation of the transcription rates in either direction (Hopf bif urcations at ρ=0.94 and ρ=1.14). Furthermore, the model shows a cyclic fold in a narrow window around ρ=1.1 with coexistence of two stable (plain) and one unstable limit cycle (dashed line). The period lengthens with increasing ρ around ρ=1. (D) The 74-dimensional mammalian Forger–Peskin model. Here, the model has both Per1 and Per2 genes, and it is thus also possible to simulate the Per1 knockout phenotypes (dashed line). In contrast to the experimental data, the Per1 mutant oscillators display slightly longer periods. Transcription can be reduced almost to zero while keeping oscillations. The period shortens with increasing ρ around ρ=1. Oscillation amplitudes for the same four models are shown in Supplementary Figure 4.
Comment in
- Circadian clocks can take a few transcriptional knocks.
O'Neill JS. O'Neill JS. EMBO J. 2009 Jan 21;28(2):84-5. doi: 10.1038/emboj.2008.272. EMBO J. 2009. PMID: 19158661 Free PMC article.
Similar articles
- Circadian clocks can take a few transcriptional knocks.
O'Neill JS. O'Neill JS. EMBO J. 2009 Jan 21;28(2):84-5. doi: 10.1038/emboj.2008.272. EMBO J. 2009. PMID: 19158661 Free PMC article. - SCFFbxl3 controls the oscillation of the circadian clock by directing the degradation of cryptochrome proteins.
Busino L, Bassermann F, Maiolica A, Lee C, Nolan PM, Godinho SI, Draetta GF, Pagano M. Busino L, et al. Science. 2007 May 11;316(5826):900-4. doi: 10.1126/science.1141194. Epub 2007 Apr 26. Science. 2007. PMID: 17463251 - Expression and functional analyses of circadian genes in mouse oocytes and preimplantation embryos: Cry1 is involved in the meiotic process independently of circadian clock regulation.
Amano T, Matsushita A, Hatanaka Y, Watanabe T, Oishi K, Ishida N, Anzai M, Mitani T, Kato H, Kishigami S, Saeki K, Hosoi Y, Iritani A, Matsumoto K. Amano T, et al. Biol Reprod. 2009 Mar;80(3):473-83. doi: 10.1095/biolreprod.108.069542. Epub 2008 Nov 19. Biol Reprod. 2009. PMID: 19020302 - Synchronization of the molecular clockwork by light- and food-related cues in mammals.
Challet E, Caldelas I, Graff C, Pévet P. Challet E, et al. Biol Chem. 2003 May;384(5):711-9. doi: 10.1515/BC.2003.079. Biol Chem. 2003. PMID: 12817467 Review. - [Synchronization and genetic redundancy in circadian clocks].
Dardente H. Dardente H. Med Sci (Paris). 2008 Mar;24(3):270-6. doi: 10.1051/medsci/2008243270. Med Sci (Paris). 2008. PMID: 18334175 Review. French.
Cited by
- Consistent robustness analysis (CRA) identifies biologically relevant properties of regulatory network models.
Saithong T, Painter KJ, Millar AJ. Saithong T, et al. PLoS One. 2010 Dec 16;5(12):e15589. doi: 10.1371/journal.pone.0015589. PLoS One. 2010. PMID: 21179566 Free PMC article. - Palmitate Inhibits SIRT1-Dependent BMAL1/CLOCK Interaction and Disrupts Circadian Gene Oscillations in Hepatocytes.
Tong X, Zhang D, Arthurs B, Li P, Durudogan L, Gupta N, Yin L. Tong X, et al. PLoS One. 2015 Jun 15;10(6):e0130047. doi: 10.1371/journal.pone.0130047. eCollection 2015. PLoS One. 2015. PMID: 26075729 Free PMC article. - Tuning the mammalian circadian clock: robust synergy of two loops.
Relógio A, Westermark PO, Wallach T, Schellenberg K, Kramer A, Herzel H. Relógio A, et al. PLoS Comput Biol. 2011 Dec;7(12):e1002309. doi: 10.1371/journal.pcbi.1002309. Epub 2011 Dec 15. PLoS Comput Biol. 2011. PMID: 22194677 Free PMC article. - Circadian-independent cell mitosis in immortalized fibroblasts.
Yeom M, Pendergast JS, Ohmiya Y, Yamazaki S. Yeom M, et al. Proc Natl Acad Sci U S A. 2010 May 25;107(21):9665-70. doi: 10.1073/pnas.0914078107. Epub 2010 May 10. Proc Natl Acad Sci U S A. 2010. PMID: 20457900 Free PMC article. - Autokinase Activity of Casein Kinase 1 δ/ε Governs the Period of Mammalian Circadian Rhythms.
Guo G, Wang K, Hu SS, Tian T, Liu P, Mori T, Chen P, Johnson CH, Qin X. Guo G, et al. J Biol Rhythms. 2019 Oct;34(5):482-496. doi: 10.1177/0748730419865406. Epub 2019 Aug 8. J Biol Rhythms. 2019. PMID: 31392916 Free PMC article.
References
- Adolph S, Brusselbach S, Muller R (1993) Inhibition of transcription blocks cell cycle progression of NIH3T3 fibroblasts specifically in G1. J Cell Sci 105 (Part 1): 113–122 - PubMed
- Arima Y, Nitta M, Kuninaka S, Zhang D, Fujiwara T, Taya Y, Nakao M, Saya H (2005) Transcriptional blockade induces p53-dependent apoptosis associated with translocation of p53 to mitochondria. J Biol Chem 280: 19166–19176 - PubMed
- Asher G, Gatfield D, Stratmann M, Reinke H, Dibner C, Kreppel F, Mostoslavsky R, Alt FW, Schibler U (2008) SIRT1 regulates circadian clock gene expression through PER2 deacetylation. Cell 134: 317–328 - PubMed
- Balsalobre A, Brown SA, Marcacci L, Tronche F, Kellendonk C, Reichardt HM, Schutz G, Schibler U (2000) Resetting of circadian time in peripheral tissues by glucocorticoid signaling. Science 289: 2344–2347 - PubMed
Publication types
MeSH terms
Substances
LinkOut - more resources
Full Text Sources
Molecular Biology Databases
Research Materials


