Coupled contagion dynamics of fear and disease: mathematical and computational explorations - PubMed (original) (raw)
Coupled contagion dynamics of fear and disease: mathematical and computational explorations
Joshua M Epstein et al. PLoS One. 2008.
Abstract
Background: In classical mathematical epidemiology, individuals do not adapt their contact behavior during epidemics. They do not endogenously engage, for example, in social distancing based on fear. Yet, adaptive behavior is well-documented in true epidemics. We explore the effect of including such behavior in models of epidemic dynamics.
Methodology/principal findings: Using both nonlinear dynamical systems and agent-based computation, we model two interacting contagion processes: one of disease and one of fear of the disease. Individuals can "contract" fear through contact with individuals who are infected with the disease (the sick), infected with fear only (the scared), and infected with both fear and disease (the sick and scared). Scared individuals--whether sick or not--may remove themselves from circulation with some probability, which affects the contact dynamic, and thus the disease epidemic proper. If we allow individuals to recover from fear and return to circulation, the coupled dynamics become quite rich, and can include multiple waves of infection. We also study flight as a behavioral response.
Conclusions/significance: In a spatially extended setting, even relatively small levels of fear-inspired flight can have a dramatic impact on spatio-temporal epidemic dynamics. Self-isolation and spatial flight are only two of many possible actions that fear-infected individuals may take. Our main point is that behavioral adaptation of some sort must be considered.
Conflict of interest statement
Competing Interests: The authors have declared that no competing interests exist.
Figures
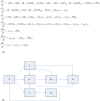
Figure 1. (A&B): Classical SIR differential equations formulation and flowchart.
Figure 2. Here we provide the coupled case with α = β = 0.0008.
One would expect that if we set α = β, the disease and fear epidemic S-curves should coincide, but this is not the case. Fear (the green curve) precedes disease (the red curve).
Figure 3. In the idealized run of figure 3, susceptible individuals (blue-curve) self-isolate (black curve) through fear as the infection of disease proper grows (red curve).
Emboldened by the falling disease incidence, these susceptibles return (prematurely) to circulation (the blue hump). But, this offers fuel to the remaining embers of infection (at time 100), and a second wave ensues.
Figure 4. We consider a simple form of the model in which fear propagates, but no one adapts their behavior in response.
All agents are “ignorers.” Parameterized in this way, the model produces quintessential SIR curves.
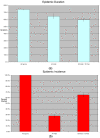
Figure 5. (A&B): Epidemic duration and total incidence under three different parameter settings.
Each bar in the chart represents an average across 30 simulation runs for a given parameter setting, with standard error range. When all agents hide, the epidemic is shorter and has substantially lower incidence that with no adaptive behavior. When a small percentage of agents flees (with the majority hiding), however, incidence goes up substantially even as the duration falls farther.
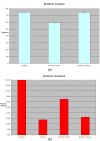
Figure 6. (A&B): A comparison of epidemic duration and total incidence with 10% “fleers” versus 10% “ignorers.”
As before, each bar in the chart represents an average across 30 simulation runs for a given parameter setting, with standard error range. The runs with 10% “ignorers” have similar incidence to runs with 100% “hiders,” and similar duration to runs with 100% “ignorers.” By contrast, the runs with 10% “fleers” have much higher incidence and lower duration.
Figure 7. The percentage of runs (out of 30) for each parameter setting in which the epidemic spreads fully across the landscape, from an index case in one corner of the lattice all the way to the opposite corner.
Figure 8. In rare cases where the epidemic spreads fully across the lattice without flight, it takes much longer to do so than in cases with flight.
Without flight the epidemic takes roughly 600 time periods to cross the lattice.
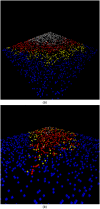
Figure 9. (A&B): Screenshots from the agent-based simulation model without and with flight.
Each agent is represented by a colored dot on the lattice.
Similar articles
- Triple contagion: a two-fears epidemic model.
Epstein JM, Hatna E, Crodelle J. Epstein JM, et al. J R Soc Interface. 2021 Aug;18(181):20210186. doi: 10.1098/rsif.2021.0186. Epub 2021 Aug 4. J R Soc Interface. 2021. PMID: 34343457 Free PMC article. - Coupling infectious diseases, human preventive behavior, and networks--a conceptual framework for epidemic modeling.
Mao L, Yang Y. Mao L, et al. Soc Sci Med. 2012 Jan;74(2):167-75. doi: 10.1016/j.socscimed.2011.10.012. Epub 2011 Nov 27. Soc Sci Med. 2012. PMID: 22154610 Free PMC article. - Who is the infector? Epidemic models with symptomatic and asymptomatic cases.
Leung KY, Trapman P, Britton T. Leung KY, et al. Math Biosci. 2018 Jul;301:190-198. doi: 10.1016/j.mbs.2018.04.002. Epub 2018 Apr 11. Math Biosci. 2018. PMID: 29654792 - Mathematical and computational challenges in population biology and ecosystems science.
Levin SA, Grenfell B, Hastings A, Perelson AS. Levin SA, et al. Science. 1997 Jan 17;275(5298):334-43. doi: 10.1126/science.275.5298.334. Science. 1997. PMID: 8994023 Review. - Coupled disease-behavior dynamics on complex networks: A review.
Wang Z, Andrews MA, Wu ZX, Wang L, Bauch CT. Wang Z, et al. Phys Life Rev. 2015 Dec;15:1-29. doi: 10.1016/j.plrev.2015.07.006. Epub 2015 Jul 8. Phys Life Rev. 2015. PMID: 26211717 Free PMC article. Review.
Cited by
- The contagion of mortality: A terror management health model for pandemics.
Courtney EP, Goldenberg JL, Boyd P. Courtney EP, et al. Br J Soc Psychol. 2020 Jul;59(3):607-617. doi: 10.1111/bjso.12392. Epub 2020 Jun 17. Br J Soc Psychol. 2020. PMID: 32557684 Free PMC article. - Health Anxiety and Its Correlations with Self-Perceived Risk and Attitude on COVID-19 among Malaysian Healthcare Workers during the Pandemic.
Mohd Salleh Sahimi H, Azman N, Nik Jaafar NR, Mohd Daud TI, Baharudin A, Ismail AK, Abdul Malek AZ, Hassan MR, Mohammed Nawi A. Mohd Salleh Sahimi H, et al. Int J Environ Res Public Health. 2021 May 3;18(9):4879. doi: 10.3390/ijerph18094879. Int J Environ Res Public Health. 2021. PMID: 34063714 Free PMC article. - Evolution of Select Epidemiological Modeling and the Rise of Population Sentiment Analysis: A Literature Review and COVID-19 Sentiment Illustration.
Daghriri T, Proctor M, Matthews S. Daghriri T, et al. Int J Environ Res Public Health. 2022 Mar 9;19(6):3230. doi: 10.3390/ijerph19063230. Int J Environ Res Public Health. 2022. PMID: 35328916 Free PMC article. Review. - Misinformation can prevent the suppression of epidemics.
Sontag A, Rogers T, Yates CA. Sontag A, et al. J R Soc Interface. 2022 Mar;19(188):20210668. doi: 10.1098/rsif.2021.0668. Epub 2022 Mar 30. J R Soc Interface. 2022. PMID: 35350880 Free PMC article. - Fear of coronavirus (COVID-19) and mental health outcomes in Palestine: The mediating role of social support.
Mahamid FA, Veronese G, Bdier D. Mahamid FA, et al. Curr Psychol. 2023;42(10):8572-8581. doi: 10.1007/s12144-021-02395-y. Epub 2021 Oct 20. Curr Psychol. 2023. PMID: 34690471 Free PMC article.
References
- Kermack W, McKendrick A. A Contribution to the Mathematical Theory of Epidemics. P Roy Soc Long A Mat. 1927;115:700–721.
- Murray B. Mathematical Biology. Biomathematics Vol 19. New York: Springer-Verlag; 1989. p. 767.
- Anderson R, May R. Infectious Diseases of Humans: Dynamics and Control. Oxford, U.K.: Oxford Science Publications; 1993. p. 768.
- Kremer M. Integrating behavioral choice into epidemiological models of the AIDS epidemic. Q J Econ. 1996;111:549–573.
- Hatfield E, Cacioppo J, Rapson R. Emotional Contagion. Cambridge: Cambridge University Press; 1994. p. 240.
Publication types
MeSH terms
LinkOut - more resources
Full Text Sources
Medical


