Towards high-throughput metabolomics using ultrahigh-field Fourier transform ion cyclotron resonance mass spectrometry - PubMed (original) (raw)
Towards high-throughput metabolomics using ultrahigh-field Fourier transform ion cyclotron resonance mass spectrometry
Jun Han et al. Metabolomics. 2008 Jun.
Abstract
With unmatched mass resolution, mass accuracy, and exceptional detection sensitivity, Fourier Transform Ion Cyclotron Resonance Mass Spectrometry (FTICR-MS) has the potential to be a powerful new technique for high-throughput metabolomic analysis. In this study, we examine the properties of an ultrahigh-field 12-Tesla (12T) FTICR-MS for the identification and absolute quantitation of human plasma metabolites, and for the untargeted metabolic fingerprinting of inbred-strain mouse serum by direct infusion (DI). Using internal mass calibration (mass error ≤1 ppm), we determined the rational elemental compositions (incorporating unlimited C, H, N and O, and a maximum of two S, three P, two Na, and one K per formula) of approximately 250 out of 570 metabolite features detected in a 3-min infusion analysis of aqueous extract of human plasma, and were able to identify more than 100 metabolites. Using isotopically-labeled internal standards, we were able to obtain excellent calibration curves for the absolute quantitation of choline with sub-pmol sensitivity, using 500 times less sample than previous LC/MS analyses. Under optimized serum dilution conditions, chemical compounds spiked into mouse serum as metabolite mimics showed a linear response over a 600-fold concentration range. DI/FTICR-MS analysis of serum from 26 mice from 2 inbred strains, with and without acute trichloroethylene (TCE) treatment, gave a relative standard deviation (RSD) of 4.5%. Finally, we extended this method to the metabolomic fingerprinting of serum samples from 49 mice from 5 inbred strains involved in an acute alcohol toxicity study, using both positive and negative electrospray ionization (ESI). Using these samples, we demonstrated the utility of this method for high-throughput metabolomics, with more than 400 metabolites profiled in only 24 h. Our experiments demonstrate that DI/FTICR-MS is well-suited for high-throughput metabolomic analysis.
Figures
Fig. 1
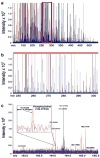
More than 570 metabolite features from an aqueous extract of human plasma were detected in a single (+) ESI/FTICR mass spectrum. (a) The overlaid mass spectra acquired from a 3-min infusion of plasma metabolites in aqueous extract taken from each of 4 subjects. (b) Expansion of a 50 Da m/z window (red box) demonstrating the mass resolution of the 12T FTICR-MS. (c) Demonstration of FTICR-MS mass accuracy with internal calibration. Even relatively low abundance ions can be sufficiently resolved to permit identification based on the calibrated mass. Inset shows the identification of phosphocholine (calculated mass = 184.07332) based on accurate mass alone. The observed mass of 184.07329 differed from the calculated mass by less than 0.2 ppm.
Fig. 2
Demonstration of ultrahigh mass precision possible with the 12T FTICR-MS using either internal or external mass calibration. Mass measurement accuracy (MMA) errors of less than 0.2 ppm for sodiated hexose were achieved with internal calibration of the spectra, while the average MMA error for external calibration was less than 0.5 ppm.
Fig. 3
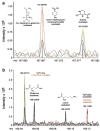
(a) Expansion of overlaid (+) ESI/FTICR mass spectra of four aqueous plasma extracts showing a 0.02 Da window from m/z 167.06 to 167.0825. The identity of the metabolite on the left (m/z 167.06788) could be narrowed down to either trans-4-hydroxycyc-lohexanecarboxylate (sodiated) or (5-L-glutamyl)-L-glutamine (sodiated) by querying the KEGG ligand database for elemental formulas within 1 ppm mass accuracy. The metabolite on the right (m/z 167.07920) could be uniquely identified as sodiated ectoine. (b) Expansion of the m/z range 169.04 to 169.13 showing the overlaid (+) ESI/FTICR mass spectra of four aqueous plasma extracts. Four metabolites were detected within this 0.09 Da window. Glutamine and lysine could be identified on the basis of accurate mass alone. In addition, the molecular formulas of two unknown metabolites could be determined based on mass.
Fig. 4
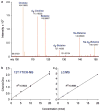
(a) Quantitation of choline using (+) ESI/MS. FTICR mass spectrum from m/z 100 to 150 obtained by mixing 20 nmol of _d_9-choline with a single concentration of unlabeled analyte, followed by DI/12T FTICR-MS for generation of a calibration curve from the peak intensity ratios for unlabeled choline versus deuterated choline (d9-Choline). (b and c) (+) ESI DI/FTICR-MS metabolite quantitation compared to metabolite quantitation by LC/MS. Calibration curves for choline obtained by DI on a 12T FTICR-MS (b) versus LC/MS on an LCQ mass spectrometer (c). For FTICR-MS calibration, the results show the ratio of peak intensities for unlabeled choline (Cho) to deuterated choline (d-Cho) versus concentration. For LC/MS analysis, the results show the unlabeled choline to deuterated choline peak area ratio versus concentration. FTICR-MS produces correlation coefficients >0.99, comparable to LC/MS.
Fig. 5
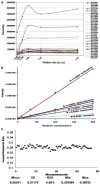
The suitability of DI/FTICR-MS for metabolic fingerprinting of serum samples from inbred mouse strains. (a) Effect of mouse serum dilution on MS intensities in positive ESI, indicating an optimal dilution of greater than 1:50 (v/v). A dilution of 1:100 was chosen for this metabolic fingerprinting study. (b) Linearity of standard chemicals (diphenhydramine, haloperidol, verapamil, terfenadine and reserpine) spiked as metabolite mimics into a mouse serum extract at a dilution of 1:100 (v/v), showing a linear response over a 600-fold concentration range. (c) The measurement variation of a metabolite mimic, verapamil, spiked equally into 26 serum samples from mice from 2 inbred strains involved in a TCE acute toxicity experiment, showing a relative standard deviation (RSD) of 4.5%.
Fig. 6
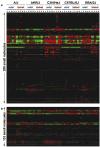
Two-dimensional metabolite features of 49 mouse serum methanol extracts analyzed by DI/FTICR-MS without prior chromatography in both (+) (a) and (−) (b) ESI modes. Blue bars represent control samples, Red bars represent treated samples. Numbers indicate individual animals (biological replicates). Three technical replicates for each biological replicate are shown. Metabolites: Red = up-regulated; Green = down-regulated; Black = median of individual relative intensities for a given metabolite across all spectra. After data processing, a total of 298 metabolites were detected in the positive ion mode across the mass range 100–900 Da, and a total of 133 metabolites were detected in the negative ion mode.
Similar articles
- Deep Characterization of Serum Metabolome Based on the Segment-Optimized Spectral-Stitching Direct-Infusion Fourier Transform Ion Cyclotron Resonance Mass Spectrometry Approach.
Sun X, Xia Y, Zhao X, Wang X, Zhang Y, Jia Z, Zheng F, Li Z, Zhang X, Zhao C, Lu X, Xu G. Sun X, et al. Anal Chem. 2023 Jul 18;95(28):10512-10521. doi: 10.1021/acs.analchem.2c04995. Epub 2023 Jul 5. Anal Chem. 2023. PMID: 37406615 - Ultrahigh-Resolution Mass Spectrometry-Based Platform for Plasma Metabolomics Applied to Type 2 Diabetes Research.
Zhu Y, Wancewicz B, Schaid M, Tiambeng TN, Wenger K, Jin Y, Heyman H, Thompson CJ, Barsch A, Cox ED, Davis DB, Brasier AR, Kimple ME, Ge Y. Zhu Y, et al. J Proteome Res. 2021 Jan 1;20(1):463-473. doi: 10.1021/acs.jproteome.0c00510. Epub 2020 Oct 15. J Proteome Res. 2021. PMID: 33054244 Free PMC article. - Translational Metabolomics of Head Injury: Exploring Dysfunctional Cerebral Metabolism with Ex Vivo NMR Spectroscopy-Based Metabolite Quantification.
Wolahan SM, Hirt D, Glenn TC. Wolahan SM, et al. In: Kobeissy FH, editor. Brain Neurotrauma: Molecular, Neuropsychological, and Rehabilitation Aspects. Boca Raton (FL): CRC Press/Taylor & Francis; 2015. Chapter 25. In: Kobeissy FH, editor. Brain Neurotrauma: Molecular, Neuropsychological, and Rehabilitation Aspects. Boca Raton (FL): CRC Press/Taylor & Francis; 2015. Chapter 25. PMID: 26269925 Free Books & Documents. Review. - Forced degradation and impurity profiling: recent trends in analytical perspectives.
Jain D, Basniwal PK. Jain D, et al. J Pharm Biomed Anal. 2013 Dec;86:11-35. doi: 10.1016/j.jpba.2013.07.013. Epub 2013 Jul 31. J Pharm Biomed Anal. 2013. PMID: 23969330 Review.
Cited by
- Accurate quantitation of standard peptides used for quantitative proteomics.
Bordeerat NK, Georgieva NI, Klapper DG, Collins LB, Cross TJ, Borchers CH, Swenberg JA, Boysen G. Bordeerat NK, et al. Proteomics. 2009 Aug;9(15):3939-44. doi: 10.1002/pmic.200900043. Proteomics. 2009. PMID: 19637239 Free PMC article. - Mass-spectrometry-based metabolomics: limitations and recommendations for future progress with particular focus on nutrition research.
Scalbert A, Brennan L, Fiehn O, Hankemeier T, Kristal BS, van Ommen B, Pujos-Guillot E, Verheij E, Wishart D, Wopereis S. Scalbert A, et al. Metabolomics. 2009 Dec;5(4):435-458. doi: 10.1007/s11306-009-0168-0. Epub 2009 Jun 12. Metabolomics. 2009. PMID: 20046865 Free PMC article. - Targeting proteomics to investigate metastasis-associated mitochondrial proteins.
Chou HC, Chan HL. Chou HC, et al. J Bioenerg Biomembr. 2012 Dec;44(6):629-34. doi: 10.1007/s10863-012-9466-8. J Bioenerg Biomembr. 2012. PMID: 22890579 Review. - Direct infusion mass spectrometry metabolomics dataset: a benchmark for data processing and quality control.
Kirwan JA, Weber RJ, Broadhurst DI, Viant MR. Kirwan JA, et al. Sci Data. 2014 Jun 10;1:140012. doi: 10.1038/sdata.2014.12. eCollection 2014. Sci Data. 2014. PMID: 25977770 Free PMC article. - Untargeted LC-HRMS Based-Plasma Metabolomics Reveals 3-O-Methyldopa as a New Biomarker of Poor Prognosis in High-Risk Neuroblastoma.
Barco S, Lavarello C, Cangelosi D, Morini M, Eva A, Oneto L, Uva P, Tripodi G, Garaventa A, Conte M, Petretto A, Cangemi G. Barco S, et al. Front Oncol. 2022 Jun 10;12:845936. doi: 10.3389/fonc.2022.845936. eCollection 2022. Front Oncol. 2022. PMID: 35756625 Free PMC article.
References
- Aharoni A, Ric de Vos CH, Verhoeven HA, Maliepaard CA, Kruppa G, Bino R, Goodenowe DB. Nontargeted metabolome analysis by use of Fourier transform ion cyclotron mass spectrometry. Omics. 2002;6(3):217–234. - PubMed
- Allen J, Davey HM, Broadhurst D, Heald JK, Rowland JJ, Oliver SG, Kell DB. High-throughput classification of yeast mutants for functional genomics using metabolic footprinting. Nature Biotechnology. 2003;21(6):692–696. - PubMed
- Belov ME, Anderson GA, Angell NH, Shen Y, Tolic N, Udseth HR, Smith RD. Dynamic range expansion applied to mass spectrometry based on data-dependent selective ion ejection in capillary liquid chromatography Fourier transform ion cyclotron resonance for enhanced proteome characterization. Analytical Chemistry. 2001;73(21):5052–5060. - PubMed
- Brown SC, Kruppa G, Dasseux JL. Metabolomics applications of FT-ICR mass spectrometry. Mass Spectrometry Reviews. 2005;24(2):223–231. - PubMed
- Buchholz A, Takors R, Wandrey C. Quantification of intracellular metabolites in Escherichia coli K12 using liquid chromatographic-electrospray ionization tandem mass spectrometric techniques. Analytical Biochemistry. 2001;295(2):129–137. - PubMed
Grants and funding
- P30 CA016086/CA/NCI NIH HHS/United States
- P30 ES010126/ES/NIEHS NIH HHS/United States
- R01 AA016258/AA/NIAAA NIH HHS/United States
- S10 RR019889/RR/NCRR NIH HHS/United States
LinkOut - more resources
Full Text Sources
Other Literature Sources
