Inference of historical changes in migration rate from the lengths of migrant tracts - PubMed (original) (raw)
Inference of historical changes in migration rate from the lengths of migrant tracts
John E Pool et al. Genetics. 2009 Feb.
Abstract
After migrant chromosomes enter a population, they are progressively sliced into smaller pieces by recombination. Therefore, the length distribution of "migrant tracts" (chromosome segments with recent migrant ancestry) contains information about historical patterns of migration. Here we introduce a theoretical framework describing the migrant tract length distribution and propose a likelihood inference method to test demographic hypotheses and estimate parameters related to a historical change in migration rate. Applying this method to data from the hybridizing subspecies Mus musculus domesticus and M. m. musculus, we find evidence for an increase in the rate of hybridization. Our findings could indicate an evolutionary trajectory toward fusion rather than speciation in these taxa.
Figures
Figure 1.—
The distribution of migrant tract lengths after the advent of admixture. Models where previously isolated populations begin exchanging migrants at rate N_e_m = 0.1 100, 200, or 300 generations ago are compared against the case in which populations exchange migrants at a constant rate N_e_m = 0.1 with no prior isolation (the single migration rate, “equilibrium” model). Depicted here is the relative abundance of migrant tracts for 0.01-cM histogram bins between 0.5 (the minimum/threshold tract length) and 5 cM. Also shown is the agreement between theoretical predictions (lines) and tracts from 1000 simulated replicates with _N_e = 10,000 (shapes).
Figure 2.—
Power to test demographic hypotheses. Shown here first are tests comparing the migration rate change model to the null model of a constant migration rate, for histories involving decreasing (A) or increasing (B) migration rates. For histories involving decreasing migration rates, power to reject a model with _m_1 constrained to be zero is shown (C). For histories involving increasing migration rates, power to reject a model with _m_2 constrained to be zero is shown (D). Significance was gauged by comparing the difference in log-likelihood scores between models to data simulated under the null model. Each data set consisted of 100 simulated haploid genomes, and a threshold tract length of 0.5 cM was used.
Figure 3.—
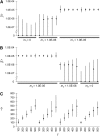
Distribution of demographic parameter estimates. Results from the analysis of simulated migrant tract data are shown, including median estimates (diamonds) and 95% confidence intervals (the 2.5 and 97.5 percentiles of the distribution of estimates) for (A) _m_1, (B) _m_2, and (C) T. The order of parameter sets is the same in each panel (i.e., the far left estimates are for true values of _m_1 = 0, _m_2 = 1_E_−5, and T = 100).
Figure 4.—
Migrant tract lengths found in M. m. domesticus and M. m. musculus, compared to constant migration rate expectations.
Similar articles
- Higher differentiation among subspecies of the house mouse (Mus musculus) in genomic regions with low recombination.
Geraldes A, Basset P, Smith KL, Nachman MW. Geraldes A, et al. Mol Ecol. 2011 Nov;20(22):4722-36. doi: 10.1111/j.1365-294X.2011.05285.x. Epub 2011 Oct 18. Mol Ecol. 2011. PMID: 22004102 Free PMC article. - Differential patterns of introgression across the X chromosome in a hybrid zone between two species of house mice.
Payseur BA, Krenz JG, Nachman MW. Payseur BA, et al. Evolution. 2004 Sep;58(9):2064-78. doi: 10.1111/j.0014-3820.2004.tb00490.x. Evolution. 2004. PMID: 15521462 - [Genetic analysis of the hybridization zone between two subspecies Mus musculus domesticus and Mus musculus musculus in Bulgaria].
Vanlerberghe F, Boursot P, Catalan J, Gerasimov S, Bonhomme F, Botev BA, Thaler L. Vanlerberghe F, et al. Genome. 1988 Jun;30(3):427-37. Genome. 1988. PMID: 3169546 French. - Inferring the history of speciation in house mice from autosomal, X-linked, Y-linked and mitochondrial genes.
Geraldes A, Basset P, Gibson B, Smith KL, Harr B, Yu HT, Bulatova N, Ziv Y, Nachman MW. Geraldes A, et al. Mol Ecol. 2008 Dec;17(24):5349-63. doi: 10.1111/j.1365-294X.2008.04005.x. Mol Ecol. 2008. PMID: 19121002 Free PMC article.
Cited by
- Nested admixture during and after the Trans-Atlantic Slave Trade on the island of São Tomé.
Ciccarella M, Laurent R, Szpiech ZA, Patin E, Dessarps-Freichey F, Utgé J, Lémée L, Semo A, Rocha J, Verdu P. Ciccarella M, et al. bioRxiv [Preprint]. 2024 Oct 23:2024.10.21.619344. doi: 10.1101/2024.10.21.619344. bioRxiv. 2024. PMID: 39484499 Free PMC article. Preprint. - Contemporary intergeneric hybridization and backcrossing among birds-of-paradise.
Thörn F, Soares AER, Müller IA, Päckert M, Frahnert S, van Grouw H, Kamminga P, Peona V, Suh A, Blom MPK, Irestedt M. Thörn F, et al. Evol Lett. 2024 Jun 8;8(5):680-694. doi: 10.1093/evlett/qrae023. eCollection 2024 Sep. Evol Lett. 2024. PMID: 39328285 Free PMC article. - Rapid Adaptation and Interspecific Introgression in the North American Crop Pest Helicoverpa zea.
North HL, Fu Z, Metz R, Stull MA, Johnson CD, Shirley X, Crumley K, Reisig D, Kerns DL, Gilligan T, Walsh T, Jiggins CD, Sword GA. North HL, et al. Mol Biol Evol. 2024 Jul 3;41(7):msae129. doi: 10.1093/molbev/msae129. Mol Biol Evol. 2024. PMID: 38941083 Free PMC article. - Neandertal ancestry through time: Insights from genomes of ancient and present-day humans.
Iasi LNM, Chintalapati M, Skov L, Mesa AB, Hajdinjak M, Peter BM, Moorjani P. Iasi LNM, et al. bioRxiv [Preprint]. 2024 May 13:2024.05.13.593955. doi: 10.1101/2024.05.13.593955. bioRxiv. 2024. PMID: 38798350 Free PMC article. Preprint. - Reconstructing complex admixture history using a hierarchical model.
Zhang S, Zhang R, Yuan K, Yang L, Liu C, Liu Y, Ni X, Xu S. Zhang S, et al. Brief Bioinform. 2024 Jan 22;25(2):bbad540. doi: 10.1093/bib/bbad540. Brief Bioinform. 2024. PMID: 38261339 Free PMC article.
References
- Boursot, P., and K. Belkhir, 2006. Mouse SNPs for evolutionary biology: beware of ascertainment biases. Genome Res. 16 1191–1192. - PubMed
- Boursot, P., J.-C. Auffray, J. Britton-Davidian and F. Bonhomme, 1993. The evolution of house mice. Annu. Rev. Ecol. Syst. 24 119–152.
Publication types
MeSH terms
Grants and funding
- F32 HG004182/HG/NHGRI NIH HHS/United States
- R01 HG003229/HG/NHGRI NIH HHS/United States
- UO1HL084706/HL/NHLBI NIH HHS/United States
- U01 HL084706/HL/NHLBI NIH HHS/United States
- R01 HG003229-05/HG/NHGRI NIH HHS/United States
LinkOut - more resources
Full Text Sources
Other Literature Sources


