Regulation of mTORC1 and mTORC2 complex assembly by phosphatidic acid: competition with rapamycin - PubMed (original) (raw)
Regulation of mTORC1 and mTORC2 complex assembly by phosphatidic acid: competition with rapamycin
Alfredo Toschi et al. Mol Cell Biol. 2009 Mar.
Abstract
mTOR, the mammalian target of rapamycin, is a critical node for control of cell growth and survival and has widely been implicated in cancer survival signals. mTOR exists in two complexes: mTORC1 and mTORC2. Phospholipase D (PLD) and its metabolite phosphatidic acid (PA) have been implicated in the regulation of mTOR; however, their role has been controversial. We report here that suppression of PLD prevents phosphorylation of the mTORC1 substrate S6 kinase (S6K) at Thr389 and the mTORC2 substrate Akt at Ser473. Suppression of PLD also blocked insulin-stimulated Akt phosphorylation at Ser473 and the mTORC2-dependent phosphorylation of PRAS40. Importantly, PA was required for the association of mTOR with Raptor to form mTORC1 and that of mTOR with Rictor to form mTORC2. The effect of PA was competitive with rapamycin-with much higher concentrations of rapamycin needed to compete with the PA-mTORC2 interaction than with PA-mTORC1. Suppressing PA production substantially increased the sensitivity of mTORC2 to rapamycin. Data provided here demonstrate a PA requirement for the stabilization of both mTORC1 and mTORC2 complexes and reveal a mechanism for the inhibitory effect of rapamycin on mTOR. This study also suggests that by suppressing PLD activity, mTORC2 could be targeted therapeutically with rapamycin.
Figures
FIG. 1.
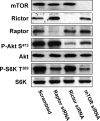
Phosphorylation of Akt at Ser473 in 786-O cells is dependent on mTORC2. 786-O cells were plated at 2 × 10⁵/60-mm plate. Twenty-four hours later, the cells were transfected with siRNA for Raptor, Rictor, or mTOR or a scrambled siRNA as described in Materials and Methods. Twenty-four hours later, the cells were treated with fresh medium containing 10% serum for an additional 48 h. The cells were then harvested and analyzed for levels of mTOR, Raptor, Rictor, Akt phosphorylated at Ser473 (P-Akt S473), Akt, S6 kinase phosphorylated at T398 (P-S6K T389), and S6 kinase (S6K) by Western blot analysis. All of the data shown are representative of at least three independent experiments.
FIG. 2.
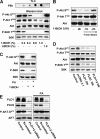
Activation of mTORC2 is dependent on PLD and PA. (A) 786-O cells were plated at 5 × 10⁵/60-mm plate for 24 h and then shifted to medium containing 0.5% serum. 1-BtOH or _tert_-BtOH was then added where indicated at the concentrations shown. After 2 h, the cells were harvested and analyzed for levels of the transphosphatidylation product PBt by TLC as described in Materials and Methods. The PBt band of the TLC plate is shown at the top. The cells were also evaluated for levels of Akt phosphorylated at Ser473 (P-Akt S473), Akt phosphorylated at Thr308 (P-Akt T308), Akt, S6 kinase phosphorylated at T398 (P-S6K T389), and S6 kinase (S6K) by Western blot analysis. (B) 786-O cells were plated as in panel A. 1-BtOH (0.8%) was then added where indicated. After 2 h, the cells were either harvested or placed in fresh medium for 1 or 2 h as indicated, at which time the cells were harvested and analyzed for levels of Akt phosphorylated at Ser473 (P-Akt S473), Akt phosphorylated at Thr308 (P-Akt T308), and Akt as in panel A. (C) 786-O cells were prepared and treated with 0.8% 1-BtOH as in panel B. PA (100 μM) was prepared as described in Materials and Methods and was added along with 1-BtOH where indicated. After 2 h, the cells were harvested and analyzed for levels of Akt phosphorylated at Ser473 (P-Akt S473), Akt, S6 kinase phosphorylated at Thr389 (P-S6K T389), and S6 kinase as in panel A. (D) 786-O cells were plated at 5 × 10⁵/60-mm plate. Twenty-four hours later, the cells were transfected with vectors expressing catalytically inactive dominant negative (DN) mutant forms of PLD1 or PLD2 as indicated. The parental vector pcDNA3.1 was used as a control. Twenty-four hours later, the cells were treated with fresh medium containing 10% serum for an additional 24 h. Control cells were treated with transfection medium but without transfection. The cells were then harvested and analyzed for levels of Akt phosphorylated at Ser473 (P-Akt S473), Akt phosphorylated at Thr308 (P-Akt T308), Akt, S6 kinase phosphorylated at Thr389 (P-S6K T389), and S6 kinase as in panel A. (E) 786-O cells were plated at 2 × 10⁵/60-mm plate. Twenty-four hours later, the cells were transfected with siRNAs for PLD1 and PLD2 or a scrambled siRNA as indicated. Control cells were treated with transfection medium but without the transfection reagent. Forty-eight hours later, the cells were treated with fresh medium containing 10% serum. The cells were then treated with fresh medium containing 10% serum for an additional 24 h and placed in medium containing 0.5% medium for 24 h. Where indicated, cells were treated with 100 μM PA for 3 h. The cells were then harvested and analyzed for levels of PLD1, PLD2, Akt phosphorylated at Ser473 (P-Akt S473), and Akt as in panel A. All of the data shown are representative of at least two independent experiments.
FIG. 3.
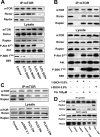
PLD is required for the formation of mTOR complexes. (A) 786-O cells were plated at 5 × 10⁵/60-mm plate for 24 h and then shifted to medium containing 0.5% serum. 1-BtOH was then added at the indicated concentrations. After 3 h, lysates were prepared and subjected to immunoprecipitation with anti-mTOR antibody overnight, and then mTOR immunoprecipitates (IP:mTOR), along with the lysates, were subjected to Western blot analysis for Rictor, Raptor, and mTOR. The lysates were also analyzed for the levels of Akt, Akt phosphorylated at Ser473 (P-Akt S473), S6 kinase, and S6 kinase phosphorylated at Thr389 (P-S6K T389). (B) 786-O cells were prepared as in panel A and then treated with 1-BtOH, _tert_-BtOH, and PA as indicated. Lysates were prepared and subjected to immunoprecipitation with anti-mTOR antibody overnight, and then the mTOR immunoprecipitates and lysates were subjected to Western blot analysis as in panel A. (C) 786-O cells were plated at 5 × 10⁵/60-mm plate. Twenty-four hours later, the cells were transfected with vectors expressing catalytically inactive dominant negative (DN) mutant forms of PLD1 and PLD2 or the parental vector pcDNA3.1 as indicated. Twenty-four hours later, the cells were treated with fresh medium containing 10% serum for an additional 24 h. Control cells were treated with transfection medium but without transfection. Lysates were then prepared and subjected to immunoprecipitation with anti-mTOR antibody overnight, and then mTOR immunoprecipitates (IP:mTOR), along with the lysates, were subjected to Western blot analysis for Rictor, Raptor, and mTOR. (D) Cells were prepared as in panel A and placed on medium containing 0.5% serum overnight. Cells were treated with the indicated alcohols (0.8%) or 200 nM rapamycin (Rap) for 2 h. The cells were then lysed in the absence or presence of DSP as described in Materials and Methods. Lysates were subjected to immunoprecipitation with anti-mTOR antibody overnight, and then the mTOR immunoprecipitates were subjected, along with the whole-cell lysate, to Western blot analysis for mTOR, Raptor, and Rictor as indicated. All of the data shown are representative of at least two independent experiments.
FIG. 4.
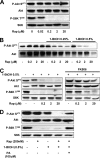
Differential sensitivity of mTORC1 and mTORC2 activities to rapamycin and 1-BtOH. (A) 786-O cells were plated at 5 × 10⁵/60-mm plate in medium containing 10% serum and incubated for 24 h. Cells were then shifted to medium containing 0.5% serum overnight. Rapamycin (Rap) was added at the indicated concentrations. The cells were harvested 8 h later, and the levels of Akt phosphorylated at Ser473 (P-Akt S473), Akt, S6 kinase phosphorylated at Thr389 (P-S6K T389), and S6 kinase (S6K) were determined by Western blot analysis. (B) 786-O cells were plated as in panel A. Rapamycin was added at the indicated concentrations in the absence or presence of either 0.25 or 0.5% 1-BtOH as indicated. Eight hours later, the cells were harvested and the levels of Akt phosphorylated at Ser473 (P-Akt S473) and Akt were determined by Western blot analysis. (C) 786-O cells were plated as in panel A. Rapamycin was added at the indicated concentrations in the absence or presence of 0.5% 1-BtOH as indicated. FK506 (10 μM) was added along with rapamycin and 1-BtOH where indicated. Eight hours later, the cells were harvested and the levels of Akt phosphorylated at Ser473 (P-Akt S473) and Akt were determined by Western blot analysis. (D) 786-O cells were prepared and treated with 0.5% 1-BtOH and 200 nM rapamycin as shown. PA (100 μM) was added along with 1-BtOH where indicated. After 8 h, the cells were harvested and analyzed for levels of Akt phosphorylated at Ser473 (P-Akt S473), Akt, S6 kinase phosphorylated at Thr389 (P-S6K T389), and S6 kinase as in panel A. All of the data shown are representative of at least two independent experiments.
FIG. 5.
Differential sensitivity of mTORC1 and mTORC2 complex formation to rapamycin and 1-BtOH. (A) 786-O cells were plated at 5 × 10⁵/60-mm plate, incubated for 24 h, and then shifted to medium containing 0.5% serum. 1-BtOH (0.25%) and the indicated concentrations of rapamycin (Rap) were added as indicated. After 6 h, lysates were prepared and subjected to immunoprecipitation with anti-mTOR antibody overnight, and then the mTOR immunoprecipitate (IP:mTOR) was subjected, along with the lysates, to Western blot analysis for Rictor and Raptor. The lysates were also analyzed for levels of Akt phosphorylated at Ser473 (P-Akt S473), Akt, S6 kinase phosphorylated at Thr389 (P-S6K T389), and S6 kinase (S6K). (B) 786-O cells were prepared as in panel A and treated with 0.5% 1-BtOH and 200 nM rapamycin as indicated. PA (100 μM) was added along with 1-BtOH where indicated. After 6 h, lysates were prepared and subjected to immunoprecipitation with anti-mTOR antibody overnight and then the mTOR immunoprecipitate was subjected, along with the lysates, to Western blot analysis for Rictor. The data shown are representative of three independent experiments.
FIG. 6.
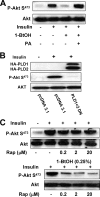
Insulin-stimulated Akt phosphorylation at Ser473 is dependent on PLD activity. (A) MDA-MB-231 cells were plated at 5 × 10⁵/60-mm plate in medium containing 10% serum and incubated for 24 h. Cells were then shifted to medium containing 0.5% serum overnight. Insulin (100 nM), 1-BtOH (0.8%), and PA (100 μM) were then added as indicated. The cells were harvested 2 h later, and the levels of Akt phosphorylated at Ser473 (P-Akt S473) and Akt were determined by Western blot analysis. (B) MDA-MB-231 cells were plated at 5 × 10⁵/60-mm plate as in Fig. 2. Twenty-four hours later, the cells were transfected with vectors expressing the catalytically inactive dominant negative (DN) mutant forms of PLD1 and PLD2 or the parental vector pcDNA3.1 as indicated. Twenty-four hours later, the cells were treated with fresh medium containing 10% serum for an additional 24 h. The cells were then harvested and analyzed for the levels of Akt phosphorylated at Ser473 (P-Akt S473) and Akt as in panel A. (C) MDA-MB-231 cells were plated as in panel A. Rapamycin (Rap) was added at the indicated concentrations in the absence or presence of 0.25% 1-BtOH as indicated. Six hours later, the cells were harvested and the levels of phosphorylated Akt and Akt were determined as in panel A. The data shown are representative of two independent experiments.
FIG. 7.
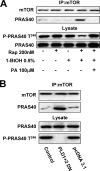
Suppression of PLD increases the association between mTOR and the mTOR inhibitory protein PRAS40. (A) 786-O cells were plated at 5 × 10⁵/60-mm plate, incubated for 24 h, and then shifted to medium containing 0.5% serum. 1-BtOH (0.5%) and rapamycin (200 nM) were added as indicated. After 6 h, lysates were prepared and subjected to immunoprecipitation with anti-mTOR antibody overnight and then the mTOR immunoprecipitate (IP:mTOR) was subjected, along with the lysates, to Western blot analysis for mTOR, PRAS40, and PRAS40 phosphorylated at Thr246 (P-PRAS40). (B) 786-O cells were plated as in panel A. Twenty-four hours later, the cells were transfected with vectors expressing catalytically inactive dominant negative (DN) mutant forms of PLD1 and PLD2 or the parental vector pcDNA3.1 as indicated. Twenty-four hours later, the cells were treated with fresh medium containing 10% serum for an additional 24 h. The cells were then harvested and analyzed for mTOR and PRAS40 in the mTOR immunoprecipitates and PRAS40 and PRAS40 phosphorylated at Thr246 (P-PRAS40) in the lysates as in panel A. The data shown are representative of two independent experiments.
FIG. 8.
Model of the differential effects of rapamycin (Rap) and 1-BtOH on mTORC1 and mTORC2. The constants of mTORC1 and mTORC2 dissociation (KDs) from PA represent the ratios of the rate constants of dissociation (kd) and formation (kf). The data provided here are consistent with a model whereby the rate constant of the dissociation of mTORC1 from PA and mTOR (kd1) is greater than the rate constant of the dissociation of mTORC2 from PA and mTOR (kd2). Thus, there are fewer dissociations of PA from mTORC2. The ability of rapamycin-FKBP12 to suppress mTORC1 and mTORC2 would be dependent on how frequently mTOR became available to bind rapamycin-FKBP12. Far more mTOR dissociated from mTORC1 than from mTORC2 would be generated, and therefore less rapamycin would be required to compete with PA for binding to the mTOR derived from mTORC1. In contrast, the rare dissociations of mTORC2 would require much more rapamycin-FKBP12 to compete with PA to capture the rare mTOR proteins derived from mTORC2. Reducing PA levels would shift the equilibrium in favor of dissociation of the mTOR complexes and therefore reduce the concentration of rapamycin-FKBP12 needed to bind to and suppress mTOR. PC, phosphatidylcholine.
Similar articles
- Involvement of mTORC1 and mTORC2 in regulation of glioblastoma multiforme growth and motility.
Gulati N, Karsy M, Albert L, Murali R, Jhanwar-Uniyal M. Gulati N, et al. Int J Oncol. 2009 Oct;35(4):731-40. doi: 10.3892/ijo_00000386. Int J Oncol. 2009. PMID: 19724909 - PRR5, a novel component of mTOR complex 2, regulates platelet-derived growth factor receptor beta expression and signaling.
Woo SY, Kim DH, Jun CB, Kim YM, Haar EV, Lee SI, Hegg JW, Bandhakavi S, Griffin TJ, Kim DH. Woo SY, et al. J Biol Chem. 2007 Aug 31;282(35):25604-12. doi: 10.1074/jbc.M704343200. Epub 2007 Jun 28. J Biol Chem. 2007. PMID: 17599906 - Receptor-recognized α₂-macroglobulin binds to cell surface-associated GRP78 and activates mTORC1 and mTORC2 signaling in prostate cancer cells.
Misra UK, Pizzo SV. Misra UK, et al. PLoS One. 2012;7(12):e51735. doi: 10.1371/journal.pone.0051735. Epub 2012 Dec 14. PLoS One. 2012. PMID: 23272152 Free PMC article. - Phosphatidic acid signaling to mTOR: signals for the survival of human cancer cells.
Foster DA. Foster DA. Biochim Biophys Acta. 2009 Sep;1791(9):949-55. doi: 10.1016/j.bbalip.2009.02.009. Epub 2009 Mar 2. Biochim Biophys Acta. 2009. PMID: 19264150 Free PMC article. Review. - Disentangling the signaling pathways of mTOR complexes, mTORC1 and mTORC2, as a therapeutic target in glioblastoma.
Jhanwar-Uniyal M, Dominguez JF, Mohan AL, Tobias ME, Gandhi CD. Jhanwar-Uniyal M, et al. Adv Biol Regul. 2022 Jan;83:100854. doi: 10.1016/j.jbior.2021.100854. Epub 2021 Dec 6. Adv Biol Regul. 2022. PMID: 34996736 Review.
Cited by
- Reciprocal regulation of AMP-activated protein kinase and phospholipase D.
Mukhopadhyay S, Saqcena M, Chatterjee A, Garcia A, Frias MA, Foster DA. Mukhopadhyay S, et al. J Biol Chem. 2015 Mar 13;290(11):6986-93. doi: 10.1074/jbc.M114.622571. Epub 2015 Jan 29. J Biol Chem. 2015. PMID: 25632961 Free PMC article. - The potential for chemical mixtures from the environment to enable the cancer hallmark of sustained proliferative signalling.
Engström W, Darbre P, Eriksson S, Gulliver L, Hultman T, Karamouzis MV, Klaunig JE, Mehta R, Moorwood K, Sanderson T, Sone H, Vadgama P, Wagemaker G, Ward A, Singh N, Al-Mulla F, Al-Temaimi R, Amedei A, Colacci AM, Vaccari M, Mondello C, Scovassi AI, Raju J, Hamid RA, Memeo L, Forte S, Roy R, Woodrick J, Salem HK, Ryan EP, Brown DG, Bisson WH. Engström W, et al. Carcinogenesis. 2015 Jun;36 Suppl 1(Suppl 1):S38-60. doi: 10.1093/carcin/bgv030. Carcinogenesis. 2015. PMID: 26106143 Free PMC article. Review. - Rapamycin-induced G1 cell cycle arrest employs both TGF-β and Rb pathways.
Chatterjee A, Mukhopadhyay S, Tung K, Patel D, Foster DA. Chatterjee A, et al. Cancer Lett. 2015 May 1;360(2):134-40. doi: 10.1016/j.canlet.2015.01.043. Epub 2015 Feb 3. Cancer Lett. 2015. PMID: 25659819 Free PMC article. - Pathologic bladder microenvironment attenuates smooth muscle differentiation of skin derived precursor cells: implications for tissue regeneration.
Tolg C, Ahsan A, Dworski S, Kirwan T, Yu J, Aitken K, Bägli DJ. Tolg C, et al. PLoS One. 2013;8(4):e59413. doi: 10.1371/journal.pone.0059413. Epub 2013 Apr 1. PLoS One. 2013. PMID: 23560047 Free PMC article. - Intersection of mTOR and STAT signaling in immunity.
Saleiro D, Platanias LC. Saleiro D, et al. Trends Immunol. 2015 Jan;36(1):21-9. doi: 10.1016/j.it.2014.10.006. Epub 2014 Nov 15. Trends Immunol. 2015. PMID: 25592035 Free PMC article. Review.
References
- Chen, Y., V. Rodrik, and D. A. Foster. 2005. Alternative phospholipase D/mTOR survival signal in human breast cancer cells. Oncogene 24672-679. - PubMed
- Chen, Y., Y. Zheng, and D. A. Foster. 2003. Phospholipase D confers rapamycin resistance in human breast cancer cells. Oncogene 223937-3942. - PubMed
- Cloughesy, T. F., K. Yoshimoto, P. Nghiemphu, K. Brown, J. Dang, S. Zhu, T. Hsueh, Y. Chen, W. Wang, D. Youngkin, L. Liau, N. Martin, D. Becker, M. Bergsneider, A. Lai, R. Green, T. Oglesby, M. Koleto, J. Trent, S. Horvath, P. S. Mischel, I. K. Mellinghoff, and C. L. Sawyers. 2008. Antitumor activity of rapamycin in a phase I trial for patients with recurrent PTEN-deficient glioblastoma. PLoS Med. 5139-151. - PMC - PubMed
- Fang, Y., M. Vilella-Bach, R. Bachmann, A. Flanigan, and J. Chen. 2001. Phosphatidic acid-mediated mitogenic activation of mTOR signaling. Science 2941942-1945. - PubMed
- Foster, D. A. 2004. Targeting mTOR-mediated survival signals in anticancer therapeutic strategies. Exp. Rev. Anticancer Ther. 4691-701. - PubMed
Publication types
MeSH terms
Substances
Grants and funding
- S06 GM060654/GM/NIGMS NIH HHS/United States
- RR-03037/RR/NCRR NIH HHS/United States
- G12 RR003037/RR/NCRR NIH HHS/United States
- R01 CA046677/CA/NCI NIH HHS/United States
- CA46677/CA/NCI NIH HHS/United States
- GM60654/GM/NIGMS NIH HHS/United States
LinkOut - more resources
Full Text Sources
Molecular Biology Databases
Miscellaneous
