Splicing factor SFRS1 recognizes a functionally diverse landscape of RNA transcripts - PubMed (original) (raw)
Splicing factor SFRS1 recognizes a functionally diverse landscape of RNA transcripts
Jeremy R Sanford et al. Genome Res. 2009 Mar.
Abstract
Metazoan genes are encrypted with at least two superimposed codes: the genetic code to specify the primary structure of proteins and the splicing code to expand their proteomic output via alternative splicing. Here, we define the specificity of a central regulator of pre-mRNA splicing, the conserved, essential splicing factor SFRS1. Cross-linking immunoprecipitation and high-throughput sequencing (CLIP-seq) identified 23,632 binding sites for SFRS1 in the transcriptome of cultured human embryonic kidney cells. SFRS1 was found to engage many different classes of functionally distinct transcripts including mRNA, miRNA, snoRNAs, ncRNAs, and conserved intergenic transcripts of unknown function. The majority of these diverse transcripts share a purine-rich consensus motif corresponding to the canonical SFRS1 binding site. The consensus site was not only enriched in exons cross-linked to SFRS1 in vivo, but was also enriched in close proximity to splice sites. mRNAs encoding RNA processing factors were significantly overrepresented, suggesting that SFRS1 may broadly influence the post-transcriptional control of gene expression in vivo. Finally, a search for the SFRS1 consensus motif within the Human Gene Mutation Database identified 181 mutations in 82 different genes that disrupt predicted SFRS1 binding sites. This comprehensive analysis substantially expands the known roles of human SR proteins in the regulation of a diverse array of RNA transcripts.
Figures
Figure 1.
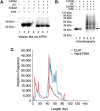
CLIP of SFRS1 from HEK293T cells and amplicon sequencing. (A) Western blot analysis of SFRS1 immunopreciptation (IP) from control and UV-cross-linked cells. CLIP was performed in three independent cultures of HEK293T cells (lanes 5–7). SFRS1 was detected with the same antibody used for IP. The blot was visualized with chemiluminescence (Pierce Super Signal). This panel demonstrates the specificity of the IP; no signal was detected in control IP samples (lane 4), but SFRS1 was efficiently precipitated from both UV-irradiated and control cell extracts. (B) Autoradiograph of 32P-labeled SFRS1–RNA complexes immobilized on nitrocellulose membrane. Following extensive washes of the immunoprecipitated complex, the beads were incubated with T4PNK (NEB) and [γ32P]ATP in order to phosphorylate the 5′ end of RNA fragments. In the absence of UV irradiation, SFRS1 can become phosphorylated. However, this does not require T4PNK (cf. lanes 1 and 2). These data suggest that a subset of SFRS1 is copurified with an SR protein kinase even under these stringent conditions. Importantly, in the absence of UV irradiation, no slower migrating protein–RNA complexes are observed (cf. lanes 1,2 and 4–6). The arrow indicates the position of “free” SFRS1 and the bracket defines the region of nitrocellulose excised from the blot. (C) Histogram comparing the amplicon length distribution with numbers of reads. Amplicons prepared from both CLIP (blue line) and nonselected input RNA samples (red line) were sequenced using the 454 FLX platform and short read reagents. As expected from B, the majority of amplicons (after removal of both linker sequences) are between 40 and 60 bp in length.
Figure 2.
Modeling the in situ SFRS1 consensus-binding motif. (A) The MEME algorithm was used to identify a consensus motif from 300 amplicons selected at random from a total of 641 blocks common to three out of four CLIP-seq experiments. This calculation was repeated 20 times. The motif with the highest sensitivity and specificity (see C) is depicted here. The likelihood of finding this motif at random is <1 × 10−107. (B) The averaged Accuracy plot for each positional weight matrix calculated from the MEME results. The prediction accuracy of the SFRS1 site was plotted as a function of matching score cutoff threshold. Maximum accuracy (78%) was achieved at a cutoff score of 5.2. This calculation was repeated 40 times using the gold standard data set. Error bars correspond to the standard deviation from the mean accuracy. (C) The averaged receiver operator characteristic curve of the SFRS1 consensus site model. This plot evaluates the sensitivity (true positive rate of discovery) and specificity (false positive discovery rate) as functions of matching score cutoff threshold. The ROC evaluates the ability of the PWM to discriminate between positive (CLIP-seq derived) and negative components (55-bp fragments selected from intergenic deserts) of the gold standard data set. This calculation was repeated 40 times. Error bars correspond to standard deviation from the mean sensitivity and specificity.
Figure 3.
Classification of _cis_-acting RNA elements bound by SFRS1. (A) Annotation strategy for classifying sequence blocks identified by CLIP-seq. Following alignment of amplicon sequences to the human genome, blocks of overlapping sequences were defined and subsequently annotated using the UCSC Known Gene and Rfam databases. Blocks were classified at the gene level (“In Gene,” “Out of Gene,” and “In ncRNA”) and at the transcript level (“In Exon,” “In Intron,” “Exon–Intron Boundary,” and “Exon–Exon Junction”). None of the blocks presented here overlapped amplicon sequences obtained from input RNA samples. (B) Quantification of block annotations. The majority of blocks were classified as “In Gene” and were predominantly associated with exon sequences. Slightly more than 25% of blocks were defined as intergenic, but binding sites for SFRS1 within these transcripts were found to be highly conserved over evolutionary time (See Supplemental Fig. 2).
Figure 4.
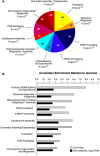
SFRS1 targets are enriched in mRNAs encoding RNA-binding proteins. (A) The top 10 classes of Gene Ontology terms enriched in the CLIP data set relative to the expected ratios in the DAVID database (Hosack et al. 2003). The top 10 classes of targets are all related to gene expression. The numbers of genes observed in each category are indicated in the pie chart. Holm-corrected EASE scores are given for each category (Hosack et al. 2003). (B) Comparison of the top 10 CLIP-enriched Gene Ontology terms with nonselected input mRNA samples. The annotation enrichment relative to the genome is plotted for both CLIP (gray bars) and input (black bars) derived mRNAs. mRNAs encoding splicing factors are most highly enriched in CLIP.
Figure 5.
Validation of SFRS1–RNA interactions by RNA–IP RT–PCR. (A) Western blot analysis of proteins precipitated by the anti-SFRS1 monoclonal antibody. SFRS1 was detected in both the input extract (lane 1) and the material immunoprecipitated with anti-SFRS1 (lane 4) but not the control beads (lanes 2,3). The blot was visualized as described in Figure 1. (B) Examples of RT–PCR analysis of endogenous SFRS1–mRNA complexes. RNA extracted from the control IP, input extract, and SFRS1 IP, was reverse transcribed using oligo dT and Superscript III (Invitrogen). A total of 78 different primer sets were used to amplify specific transcripts from cDNA. (C) Summary of RT–PCR validation of 78 randomly selected sequence blocks identified by CLIP-seq. Validated interactions correspond to detectable PCR product in both the input and SFRS1 IP samples. False positive transcripts correspond to PCR products present in the input and the control IP. Technical failures yielded no PCR products from any cDNA sample, indicating that the transcript could not be directly validated under these conditions.
Figure 6.
The SFRS1 consensus motif was enriched in blocks identified by CLIP relative to randomly selected blocks from exon sequences. The average number of SFRS1 consensus sites per nucleotide was determined and plotted for sequence blocks in 8693 constitutive (black bars) and 426 alternative cassette exons (gray bars) identified by the CLIP-seq experiment. For the control group, 55 bp regions were selected at random from equal numbers of constitutive or alternative cassette exons not contained in the pool of SFRS1 CLIP-seq data. The Wilcoxon test confirmed the mean binding sites per nucleotide were significantly different for CLIP-seq and control exons (P < 10−22). Binding sites for SFRS1 in alternative cassette exons were found to be modestly enriched relative to constitutive exons (P < 0.005).
Figure 7.
SFRS1 binding sites are enriched at fixed positions relative to splice sites. The adjusted frequency of SFRS1 consensus sites within 10-bp bins (N′) at a specific position relative to splice sites (i) was calculated by multiplying the number of consensus sites observed by the total number of exons divided by exon ≥2i in length. In A–C, the blue and red lines represent the sense or antisense PWMs, respectively. (A) Positions of SFRS1 binding sites within sequence blocks identified by CLIP-seq. (B) Positions of SFRS1 binding sites across full-length exons targeted by SFRS1. (C) Positions of SFRS1 binding sites across randomly selected exons from the human genome. (D) The distance from splice sites to the midpoints of CLIP-seq amplicons was calculated as described above. CLIP-seq and Input Amplicon midpoints (blue and orange lines, respectively) were compared with randomly selected “points” picked from exons selected at random from the genome (red lines). This comparison demonstrated that the amplicons identified by CLIP were enriched relative to the input samples at the boundaries of exons. Likewise, randomly selected “points” differ dramatically with respect to the experimentally observed amplicon midpoints.
Figure 8.
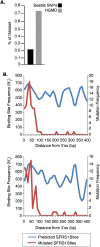
Disruption of SFRS1 binding sites can cause human inherited disease. (A) Single-nucleotide substitutions causing loss of predicted SFRS1 binding sites in the Human Gene Mutation Database (
) and the SeattleSNPs database (
) were identified by scanning reference and mutated exon sequences with the SFRS1 PWM. The proportion of entries in each database giving rise to a loss of SFRS1 sites was then plotted, and a statistically significant difference between the HGMD and SeattleSNPs data sets observed (P < 10−5; Fisher's exact test). (B) Disease mutations resulting in the loss of SFRS1 binding sites were found to be largely confined to exon boundaries. The top and bottom panels plot mutated sites relative to the 5′ and 3′ splice sites, respectively. The blue line in each plot represents the distribution of SFRS1 binding sites throughout the HGMD exons. The red lines correspond to the distribution of sites ablated by disease-causing mutations. These data demonstrate that although binding sites for SFRS1 can be predicted across HGMD exons, disease mutations tend only to disrupt those SFRS1 binding sites that are in close proximity to splice sites.
Similar articles
- Identification of nuclear and cytoplasmic mRNA targets for the shuttling protein SF2/ASF.
Sanford JR, Coutinho P, Hackett JA, Wang X, Ranahan W, Caceres JF. Sanford JR, et al. PLoS One. 2008 Oct 8;3(10):e3369. doi: 10.1371/journal.pone.0003369. PLoS One. 2008. PMID: 18841201 Free PMC article. - Binding sites for Rev and ASF/SF2 map to a 55-nucleotide purine-rich exonic element in equine infectious anemia virus RNA.
Chung H, Derse D. Chung H, et al. J Biol Chem. 2001 Jun 1;276(22):18960-7. doi: 10.1074/jbc.M008996200. Epub 2001 Mar 16. J Biol Chem. 2001. PMID: 11278454 - Structural, functional, and protein binding analyses of bovine papillomavirus type 1 exonic splicing enhancers.
Zheng ZM, He PJ, Baker CC. Zheng ZM, et al. J Virol. 1997 Dec;71(12):9096-107. doi: 10.1128/JVI.71.12.9096-9107.1997. J Virol. 1997. PMID: 9371566 Free PMC article. - Regulation of gene expression programmes by serine-arginine rich splicing factors.
Änkö ML. Änkö ML. Semin Cell Dev Biol. 2014 Aug;32:11-21. doi: 10.1016/j.semcdb.2014.03.011. Epub 2014 Mar 19. Semin Cell Dev Biol. 2014. PMID: 24657192 Review. - SR proteins as potential targets for therapy.
Soret J, Gabut M, Tazi J. Soret J, et al. Prog Mol Subcell Biol. 2006;44:65-87. doi: 10.1007/978-3-540-34449-0_4. Prog Mol Subcell Biol. 2006. PMID: 17076265 Review.
Cited by
- Genome-wide analysis reveals SR protein cooperation and competition in regulated splicing.
Pandit S, Zhou Y, Shiue L, Coutinho-Mansfield G, Li H, Qiu J, Huang J, Yeo GW, Ares M Jr, Fu XD. Pandit S, et al. Mol Cell. 2013 Apr 25;50(2):223-35. doi: 10.1016/j.molcel.2013.03.001. Epub 2013 Apr 4. Mol Cell. 2013. PMID: 23562324 Free PMC article. - Drosophila Imp iCLIP identifies an RNA assemblage coordinating F-actin formation.
Hansen HT, Rasmussen SH, Adolph SK, Plass M, Krogh A, Sanford J, Nielsen FC, Christiansen J. Hansen HT, et al. Genome Biol. 2015 Jun 9;16(1):123. doi: 10.1186/s13059-015-0687-0. Genome Biol. 2015. PMID: 26054396 Free PMC article. - Identification of RNA-protein interaction networks using PAR-CLIP.
Ascano M, Hafner M, Cekan P, Gerstberger S, Tuschl T. Ascano M, et al. Wiley Interdiscip Rev RNA. 2012 Mar-Apr;3(2):159-77. doi: 10.1002/wrna.1103. Epub 2011 Dec 27. Wiley Interdiscip Rev RNA. 2012. PMID: 22213601 Free PMC article. Review. - Spinocerebellar ataxia type 31 is associated with "inserted" penta-nucleotide repeats containing (TGGAA)n.
Sato N, Amino T, Kobayashi K, Asakawa S, Ishiguro T, Tsunemi T, Takahashi M, Matsuura T, Flanigan KM, Iwasaki S, Ishino F, Saito Y, Murayama S, Yoshida M, Hashizume Y, Takahashi Y, Tsuji S, Shimizu N, Toda T, Ishikawa K, Mizusawa H. Sato N, et al. Am J Hum Genet. 2009 Nov;85(5):544-57. doi: 10.1016/j.ajhg.2009.09.019. Epub 2009 Oct 29. Am J Hum Genet. 2009. PMID: 19878914 Free PMC article. - Noncanonical transcript forms in yeast and their regulation during environmental stress.
Yoon OK, Brem RB. Yoon OK, et al. RNA. 2010 Jun;16(6):1256-67. doi: 10.1261/rna.2038810. Epub 2010 Apr 26. RNA. 2010. PMID: 20421314 Free PMC article.
References
- Bailey T.L., Elkan C. The value of prior knowledge in discovering motifs with MEME. Proc. Int. Conf. Intell. Syst. Mol. Biol. 1995;3:21–29. - PubMed
- Bejerano G., Pheasant M., Makunin I., Stephen S., Kent W.J., Mattick J.S., Haussler D. Ultraconserved elements in the human genome. Science. 2004;304:1321–1325. - PubMed
- Betz R., Rensing C., Otto E., Mincheva A., Zehnder D., Lichter P., Hildebrandt F. Children with ocular motor apraxia type Cogan carry deletions in the gene (NPHP1) for juvenile nephronophthisis. J. Pediatr. 2000;136:828–831. - PubMed
Publication types
MeSH terms
Substances
Grants and funding
- K22LM009135/LM/NLM NIH HHS/United States
- K22 LM009135/LM/NLM NIH HHS/United States
- 1R01GM085121/GM/NIGMS NIH HHS/United States
- R01LM009722/LM/NLM NIH HHS/United States
- R01 LM009722/LM/NLM NIH HHS/United States
- R01 GM085121/GM/NIGMS NIH HHS/United States
LinkOut - more resources
Full Text Sources
Other Literature Sources
Molecular Biology Databases
Research Materials


