A rapid biosensor-based method for quantification of free and glucose-conjugated salicylic acid - PubMed (original) (raw)
A rapid biosensor-based method for quantification of free and glucose-conjugated salicylic acid
Christopher T Defraia et al. Plant Methods. 2008.
Abstract
Background: Salicylic acid (SA) is an important signalling molecule in plant defenses against biotrophic pathogens. It is also involved in several other processes such as heat production, flowering, and germination. SA exists in the plant as free SA and as an inert glucose conjugate (salicylic acid 2-O-beta-D-glucoside or SAG). Recently, Huang et al. developed a bacterial biosensor that responds to free SA but not SAG, designated as Acinetobacter sp. ADPWH_lux. In this paper we describe an improved methodology for Acinetobacter sp. ADPWH_lux-based free SA quantification, enabling high-throughput analysis, and present an approach for the quantification of SAG from crude plant extracts.
Results: On the basis of the original biosensor-based method, we optimized extraction and quantification. SAG content was determined by treating crude extracts with beta-glucosidase, then measuring the released free SA with the biosensor. beta-glucosidase treatment released more SA in acetate buffer extract than in Luria-Bertani (LB) extract, while enzymatic hydrolysis in either solution released more free SA than acid hydrolysis. The biosensor-based method detected higher amounts of SA in pathogen-infected plants than did a GC/MS-based method. SA quantification of control and pathogen-treated wild-type and sid2 (SA induction-deficient) plants demonstrated the efficacy of the method described. Using the methods detailed here, we were able to detect as little as 0.28 mug SA/g FW. Samples typically had a standard deviation of up to 25% of the mean.
Conclusion: The ability of Acinetobacter sp. ADPWH_lux to detect SA in a complex mixture, combined with the enzymatic hydrolysis of SAG in crude extract, allowed the development of a simple, rapid, and inexpensive method to simultaneously measure free and glucose-conjugated SA. This approach is amenable to a high-throughput format, which would further reduce the cost and time required for biosensor-based SA quantification. Possible applications of this approach include characterization of enzymes involved in SA metabolism, analysis of temporal changes in SA levels, and isolation of mutants with aberrant SA accumulation.
Figures
Figure 1
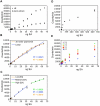
Standard curve optimization. (A) Effect of plant extract on SA-induced luminescence. SA standards were made with either LB or sid2-2 plant extract as the solvent. (B) Non-linearity of the SA-response curve. Data points were fitted with linear (blue) and third order polynomial (orange) best-fit lines. Note the lower R-squared value of the linear best-fit line. (C) A typical set of best-fit standard curves based on SA standards. The low SA concentration curve (orange) was fitted to standards of 0.8, 1.6, and 3.2 ng SA. The medium SA concentration curve (blue) was fitted to standards of 8, 16, 24, and 32 ng SA. The high SA concentration curve (green) was fitted to standards of 40, 48, 56, and 64 ng SA. (D) Diminishing response of the biosensor to increasing SA concentrations. (E) Effect of biosensor culture density on SA-induced luminescence. Biosensor cultures of OD600 = 0.6–0.8 were also tested and exhibited lower response to SA than OD600 = 0.4, but were omitted for clarity, as were error bars. Values indicate the average of three replicates with standard deviation (A-D only). Experiments were done three times with similar results.
Figure 2
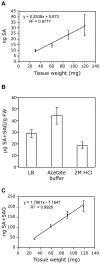
Accuracy of ADPWH_lux-based SA and SAG quantification. (A) SA measurement of varying Psm ES4326-infected tissue mass. (B) Comparison of extraction solvents for SA+SAG quantification. Psm ES4326-infected tissue was extracted with the indicated solvent. SA+SAG content was then determined as in Methods. (C) SA+SAG measurement of varying Psm ES4326-infected tissue mass. SA and SA+SAG measurements were done as described in Methods.
Figure 3
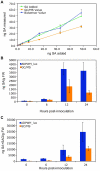
Comparison of ADPWH_ _lux_- and GC/MS-based methods for SA quantification. (A) Quantification of SA from plant extracts with known amounts of SA added. The same extracts were used for SA quantification with each method. (B) Free SA from Psm ES4326-infected wild type. Known SA amounts added were 0.6, 2.2, 3.8, 8.6, 16.6, 32.6, and 48.6 ng. (C) SA+SAG from Psm ES4326-infected wild type. Values are the mean of 8 samples read in triplicate with standard deviation.
Figure 4
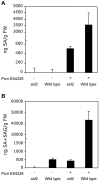
SA measurement of untreated and Psm ES4326-infected wild-type and sid2-2 plants. (A) SA. (B) SA+SAG. Values are the mean of 8 samples read in triplicate with standard deviation. Experiments were done three times with similar results.
Figure 5
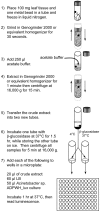
Schematic of Acinetobacter sp. ADPWH_ _lux_-based SA and SAG quantification.
Similar articles
- A high-throughput method for isolation of salicylic acid metabolic mutants.
Marek G, Carver R, Ding Y, Sathyanarayan D, Zhang X, Mou Z. Marek G, et al. Plant Methods. 2010 Sep 23;6:21. doi: 10.1186/1746-4811-6-21. Plant Methods. 2010. PMID: 20863393 Free PMC article. - A large-scale genetic screen for mutants with altered salicylic acid accumulation in Arabidopsis.
Ding Y, Shaholli D, Mou Z. Ding Y, et al. Front Plant Sci. 2015 Jan 7;5:763. doi: 10.3389/fpls.2014.00763. eCollection 2014. Front Plant Sci. 2015. PMID: 25610446 Free PMC article. - Quantification of Salicylic Acid (SA) and SA-glucosides in Arabidopsis thaliana.
Allasia V, Industri B, Ponchet M, Quentin M, Favery B, Keller H. Allasia V, et al. Bio Protoc. 2018 May 20;8(10):e2844. doi: 10.21769/BioProtoc.2844. eCollection 2018 May 20. Bio Protoc. 2018. PMID: 34285965 Free PMC article. - Pandemonium Breaks Out: Disruption of Salicylic Acid-Mediated Defense by Plant Pathogens.
Qi G, Chen J, Chang M, Chen H, Hall K, Korin J, Liu F, Wang D, Fu ZQ. Qi G, et al. Mol Plant. 2018 Dec 3;11(12):1427-1439. doi: 10.1016/j.molp.2018.10.002. Epub 2018 Oct 15. Mol Plant. 2018. PMID: 30336330 Review. - Salicylic acid signaling in disease resistance.
Kumar D. Kumar D. Plant Sci. 2014 Nov;228:127-34. doi: 10.1016/j.plantsci.2014.04.014. Epub 2014 Apr 28. Plant Sci. 2014. PMID: 25438793 Review.
Cited by
- Imposed glutathione-mediated redox switch modulates the tobacco wound-induced protein kinase and salicylic acid-induced protein kinase activation state and impacts on defence against Pseudomonas syringae.
Matern S, Peskan-Berghoefer T, Gromes R, Kiesel RV, Rausch T. Matern S, et al. J Exp Bot. 2015 Apr;66(7):1935-50. doi: 10.1093/jxb/eru546. Epub 2015 Jan 26. J Exp Bot. 2015. PMID: 25628332 Free PMC article. - A Long Non-Coding RNA of Citrus tristeza virus: Role in the Virus Interplay with the Host Immunity.
Kang SH, Sun YD, Atallah OO, Huguet-Tapia JC, Noble JD, Folimonova SY. Kang SH, et al. Viruses. 2019 May 14;11(5):436. doi: 10.3390/v11050436. Viruses. 2019. PMID: 31091710 Free PMC article. - Arabidopsis inositol polyphosphate kinases IPK1 and ITPK1 modulate crosstalk between SA-dependent immunity and phosphate-starvation responses.
Gulabani H, Goswami K, Walia Y, Roy A, Noor JJ, Ingole KD, Kasera M, Laha D, Giehl RFH, Schaaf G, Bhattacharjee S. Gulabani H, et al. Plant Cell Rep. 2022 Feb;41(2):347-363. doi: 10.1007/s00299-021-02812-3. Epub 2021 Nov 19. Plant Cell Rep. 2022. PMID: 34797387 - CYCLIC NUCLEOTIDE-GATED ION CHANNEL 2 modulates auxin homeostasis and signaling.
Chakraborty S, Toyota M, Moeder W, Chin K, Fortuna A, Champigny M, Vanneste S, Gilroy S, Beeckman T, Nambara E, Yoshioka K. Chakraborty S, et al. Plant Physiol. 2021 Nov 3;187(3):1690-1703. doi: 10.1093/plphys/kiab332. Plant Physiol. 2021. PMID: 34618044 Free PMC article. - Genetic requirements for signaling from an autoactive plant NB-LRR intracellular innate immune receptor.
Roberts M, Tang S, Stallmann A, Dangl JL, Bonardi V. Roberts M, et al. PLoS Genet. 2013;9(4):e1003465. doi: 10.1371/journal.pgen.1003465. Epub 2013 Apr 25. PLoS Genet. 2013. PMID: 23633962 Free PMC article.
References
- Shakirova FM, Sakhabutdinova AR, Bezrukova MV, Fatkhutdinova RA, Fatkhutdinova DR. Changes in the hormonal status of wheat seedlings induced by salicylic acid and salinity. Plant Sci. 2003;164:317–322. doi: 10.1016/S0168-9452(02)00415-6. - DOI
LinkOut - more resources
Full Text Sources
Miscellaneous
