Synaptic vesicles in mature calyx of Held synapses sense higher nanodomain calcium concentrations during action potential-evoked glutamate release - PubMed (original) (raw)
Synaptic vesicles in mature calyx of Held synapses sense higher nanodomain calcium concentrations during action potential-evoked glutamate release
Lu-Yang Wang et al. J Neurosci. 2008.
Abstract
During development of the calyx of Held synapse, presynaptic action potentials (APs) become substantially faster and briefer. Nevertheless, this synapse is able to upregulate quantal output triggered by arriving APs. Briefer APs lead to less effective gating of voltage-gated Ca(2+) channels (VGCCs). Therefore, mechanisms downstream of Ca(2+) entry must effectively compensate for the attenuated Ca(2+) influx associated with shorter APs in more mature calyces. This compensation could be achieved by tighter spatial coupling between VGCCs and synaptic vesicles, so that the latter are exposed to higher intracellular Ca(2+) concentration ([Ca(2+)](i)). Alternatively or additionally, the Ca(2+) sensitivity of the release apparatus may increase during synapse development. To differentiate between these possibilities, we combined paired patch-clamp recordings with Ca(2+) imaging and flash photolysis of caged Ca(2+) and estimated the [Ca(2+)](i) requirements for vesicle release in the developing mouse calyx of Held synapse. Surprisingly, the dose-response relationship between [Ca(2+)](i) and release rate was shifted slightly to the right in more mature calyces, rendering their vesicles slightly less sensitive to incoming Ca(2+). Taking into account the time course and peak rates of AP-evoked release transients for the corresponding developmental stages, we estimate the local [Ca(2+)](i)"seen" by the Ca(2+) sensors on synaptic vesicles to increase from 35 to 56 mum [from postnatal day 9 (P9)-P11 to P16-P19]. Our results reinforce the idea that developmental tightening of the spatial coupling between VGCCs and synaptic vesicles plays a predominant role in enhancing quantal output at this synapse and possibly other central synapses.
Figures
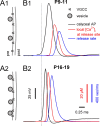
Figure 1.
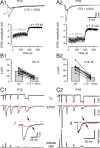
Estimating quantal size and deconvolution analysis of EPSCs. A, Fluctuation analysis of EPSCs evoked by afferent-fiber stimulation recorded in a P10 (A1) and a P18 (A2) calyx synapse under control conditions and in the presence of 100 μ
m
CTZ and 2 m
m
γ-DGG. Three consecutive EPSCs are shown superimposed for each condition. Stimulation frequency was 1/s. B, Quantal size estimates were derived from fluctuation of eEPSC peak amplitudes using variance–mean analysis. At least 200 eEPSCs from each synapse were analyzed for control conditions as well as in the presence of CTZ + γDGG. C, Deconvolution analysis of EPSCs evoked by sustained presynaptic depolarizations. Typical recordings from a P10 (C1) and a P16 (C2) synapse. Traces shown are presynaptic _I_Ca(V) (top row), EPSCs (middle row), and corresponding release rates (bottom row) derived using a deconvolution algorithm incorporating a correction for residual currents (red traces). Terminals were voltage clamped (_V_h = −80 mV) and depolarized to 70 mV for ∼120 ms. During this time interval, Ca2+ influx episodes of increasing duration were elicited by briefly stepping _V_m to 0 mV. These Ca2+ currents evoked EPSCs of variable amplitudes and durations, which allowed us to estimate parameters determining the kinetics of quantal events and the time course of residual currents (red) for use in deconvolution. EPSCs evoked by the last _I_Ca(V) are shown on a faster time scale in i and ii to illustrate the strongly reduced residual glutamate current (arrows) in the P16 synapse.
Figure 2.
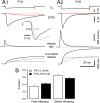
Estimating the size of the RRP. A, Presynaptic terminals were depolarized to 0 mV for 50 ms (_I_Ca(V), top row), and the evoked EPSCs (second row) were deconvolved using the parameters derived using the template protocol (Fig. 1) to estimate the time course of release (third row). At both the P10 (A1) and the P16 (A2) synapse, depolarizations of 50 ms duration completely depleted the RRP, as indicated by the rapid decay of the EPSCs to baseline. The early EPSCs are superimposed in inset i for comparison. Release rates were integrated to estimate the cumulative release (bottom row). Two kinetically distinct release components were identified at P9–P11 and P16–P19 (broken lines). B, Fractions of fast-releasing and slowly releasing vesicles during 50 ms presynaptic depolarizations. On average, the contribution of fast-releasing vesicles to the total RRP size slightly increased during development from 35 ± 5% to 43 ± 4%.
Figure 3.
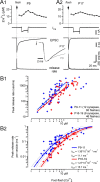
Changes in intracellular Ca2+ dependence of release during postnatal maturation. A, Deconvolution analysis of EPSCs evoked by presynaptic Ca2+ uncaging in a young (P9, A1) and a more mature (P17, A2) synapse. Traces shown are time courses of postflash [Ca2+]i (top), _I_Ca(V) (second row), EPSC (third row), and release rate (bottom row). EPSCs were recorded in the presence of 100 μ
m
CTZ and 2 m
m
γ-DGG. For comparison, flash-evoked EPSCs are shown on a faster time scale in i. Flash-photolysis-evoked Ca2+ uncaging was followed by a 50 ms presynaptic depolarization to completely deplete the RRP. Estimates of the total RRP size were used later to convert absolute release rates into rates per vesicle. B, Raw release rate (B1) and release rate per vesicle (B2) plotted as a function of presynaptic postflash [Ca2+]i. Pooled data representing 60 and 46 flash-evoked EPSCs recorded in 12 P9–P11 synapses (gray) and 9 P16–P19 synapses (black), respectively. Line fits of raw release rates versus [Ca2+]i in double-logarithmic plots (solid lines in B1) yielded slope values of ∼2.5–3 for [Ca2+]i elevations between 2.7 and 11.3 μ
m
. Solid and dotted lines in B2 represent kinetic model fits and 95% confidence limits, respectively. A five-site kinetic model (Schneggenburger and Neher, 2000) was used to fit the data, with the fusion rate γ and the cooperativity factor b fixed to 6 ms−1 and 0.25, respectively. _K_D values (_k_off/_k_on) for the two age groups were 81 ± 15 μ
m
(P9–P11) and 123 ± 12 μ
m
(P16–P19) (p = 0.024).
Figure 4.
Developmental changes in the time course of phasic AP-evoked glutamate release. A, AP-evoked eEPSCs (top row) in a P10 (A1) and a P18 (A2) synapse. For comparison, both eEPSCs were normalized and aligned at their onsets (i). mEPSCs waveforms (middle row) obtained by averaging 147 (A1) and 591 (A2) spontaneously occurring mEPSCs were used to deconvolve eEPSCs and estimate the time course of AP-evoked release (bottom row). AP-evoked EPSCs were recorded in the absence of CTZ and γ-DGG. Deconvolution of AP-evoked EPSCs was performed in the time domain using fast Fourier transform algorithms. B, Scatter plot of peak rates versus half-width of the release transients for P9–P11 (blue) and P16–P19 (red) synapses. Although data points from both age groups show some overlap, the release transients were on average briefer and had higher amplitudes in mature synapses. Dotted lines indicate mean values (Table 1). C, Comparison of the average release time course for P9–P11 (blue) and P16–P19 (red) synapses. Release transients were peak-aligned at 0 ms before averaging. Both the rise and decay of the average release function were significantly faster in more mature synapses.
Figure 5.
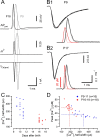
Developmental increase in peak [Ca2+]i at release sites during AP-evoked release. A, Simulation of presynaptic _I_Ca(V). AP waveforms (top row) were used to drive an HH-type model and estimate the activation parameter m2 (middle row) and presynaptic _I_Ca(V) (bottom row) for a P9 (gray) and a P16 (black) terminal. Note the significantly faster kinetics of the presynaptic AP at P16 (half-width 175 μs) compared with P9 (half-width 359 μs), leading to less efficient and briefer opening of presynaptic Ca2+ channels. Total Ca2+ charges were 0.79 pC (P9) and 0.25 pC (P16). B, Estimates for the time course of local [Ca2+]i transients (red) during presynaptic APs were derived by fitting a five-site kinetic model to the release transients (black traces, bottom rows) of AP-evoked eEPSCs (top rows). Typical recordings from a P9 (B1) and a P17 (B2) synapse are illustrated. Values for _k_on and _k_off were set as determined for the two age groups in Figure 3. Inverted versions of the simulated _I_Ca(V) (A) for each age were used as initial estimates for generating the waveform of the local [Ca2+]i used to drive the five-site kinetic model (bottom rows). During the fit, the amplitude and width of the [Ca2+]i transient, as well as the delay between the [Ca2+]i transient and the release transient, were free parameters. A variable width of the [Ca2+]i transient was allowed for by substituting the decay of the inverted _I_Ca(V) waveforms (dotted red traces) with a Gaussian function of variable σ (solid red traces). The release time course predicted by the model (superimposed gray traces) agreed well with the deconvolution-derived released transient (black traces). C, Half-width of the local [Ca2+]i transients plotted against age, indicating developmental shortening of the local Ca2+ signal. D, Scatter plot of peak [Ca2+]i versus half-width of the [Ca2+]i transients. Dotted lines indicated mean values (Table 1). Higher peaks compensate for a shorter duration of the local Ca2+ transients during development.
Figure 6.
Summary of developmental changes in the timing of the local [Ca2+]i transient and glutamate release. A, Schematic diagram illustrating developmental tightening in the coupling between synaptic vesicles and VGCCs. Immature calyces (A1) have fewer docked vesicles that are loosely coupled to VGCCs, whereas mature calyces (A2) possess approximately a twofold larger number of release-competent vesicles that more closely colocalize with Ca2+ channels. B, Timing (right) of the local [Ca2+]i (red) and release (blue) transients relative to the presynaptic APs (black) for P9–P11 (B1) and P16–P19 (B2) calyx synapses. Traces in B1 and B2 were aligned relative to the onset of the presynaptic APs (dotted line). The average time course of the AP-evoked local [Ca2+]i transients was obtained from 16 P9–P11 and 18 P16–P19 synapses that were analyzed as described in Figure 5. The peak of the local [Ca2+]i transient occurred ∼410 μs earlier in mature synapses, because of their faster and briefer presynaptic APs.
Similar articles
- Developmental transformation of the release modality at the calyx of Held synapse.
Fedchyshyn MJ, Wang LY. Fedchyshyn MJ, et al. J Neurosci. 2005 Apr 20;25(16):4131-40. doi: 10.1523/JNEUROSCI.0350-05.2005. J Neurosci. 2005. PMID: 15843616 Free PMC article. - Presynaptic Ca2+ requirements and developmental regulation of posttetanic potentiation at the calyx of Held.
Korogod N, Lou X, Schneggenburger R. Korogod N, et al. J Neurosci. 2005 May 25;25(21):5127-37. doi: 10.1523/JNEUROSCI.1295-05.2005. J Neurosci. 2005. PMID: 15917453 Free PMC article. - Control of synaptic strength and timing by the release-site Ca2+ signal.
Bollmann JH, Sakmann B. Bollmann JH, et al. Nat Neurosci. 2005 Apr;8(4):426-34. doi: 10.1038/nn1417. Epub 2005 Mar 6. Nat Neurosci. 2005. PMID: 15750590 - Estimation of quantal parameters at the calyx of Held synapse.
Sakaba T, Schneggenburger R, Neher E. Sakaba T, et al. Neurosci Res. 2002 Dec;44(4):343-56. doi: 10.1016/s0168-0102(02)00174-8. Neurosci Res. 2002. PMID: 12445623 Review. - Presynaptic Black Box Opened by Pioneers at Biophysics Department in University College London.
Takahashi T. Takahashi T. Neuroscience. 2020 Jul 15;439:10-21. doi: 10.1016/j.neuroscience.2019.04.029. Epub 2019 May 18. Neuroscience. 2020. PMID: 31108128 Review.
Cited by
- Reduced endogenous Ca2+ buffering speeds active zone Ca2+ signaling.
Delvendahl I, Jablonski L, Baade C, Matveev V, Neher E, Hallermann S. Delvendahl I, et al. Proc Natl Acad Sci U S A. 2015 Jun 9;112(23):E3075-84. doi: 10.1073/pnas.1508419112. Epub 2015 May 26. Proc Natl Acad Sci U S A. 2015. PMID: 26015575 Free PMC article. - An Exclusion Zone for Ca2+ Channels around Docked Vesicles Explains Release Control by Multiple Channels at a CNS Synapse.
Keller D, Babai N, Kochubey O, Han Y, Markram H, Schürmann F, Schneggenburger R. Keller D, et al. PLoS Comput Biol. 2015 May 7;11(5):e1004253. doi: 10.1371/journal.pcbi.1004253. eCollection 2015 May. PLoS Comput Biol. 2015. PMID: 25951120 Free PMC article. - Structural and functional maturation of active zones in large synapses.
Cano R, Torres-Benito L, Tejero R, Biea AI, Ruiz R, Betz WJ, Tabares L. Cano R, et al. Mol Neurobiol. 2013 Feb;47(1):209-19. doi: 10.1007/s12035-012-8347-9. Epub 2012 Sep 20. Mol Neurobiol. 2013. PMID: 22992975 Review. - Synaptotagmin Ca2+ Sensors and Their Spatial Coupling to Presynaptic Cav Channels in Central Cortical Synapses.
Bornschein G, Schmidt H. Bornschein G, et al. Front Mol Neurosci. 2019 Jan 15;11:494. doi: 10.3389/fnmol.2018.00494. eCollection 2018. Front Mol Neurosci. 2019. PMID: 30697148 Free PMC article. Review. - Single calcium channel domain gating of synaptic vesicle fusion at fast synapses; analysis by graphic modeling.
Stanley EF. Stanley EF. Channels (Austin). 2015;9(5):324-33. doi: 10.1080/19336950.2015.1098793. Channels (Austin). 2015. PMID: 26457441 Free PMC article.
References
- BeutnerD, Voets T, Neher E, Moser T (2001) Calcium dependence of exocytosis and endocytosis at the cochlear inner hair cell afferent synapse. Neuron 29:681–690. - PubMed
- BollmannJH, Sakmann B (2005) Control of synaptic strength and timing by the release-site Ca2+ signal. Nat Neurosci 8:426–434. - PubMed
- BollmannJH, Sakmann B, Borst JG (2000) Calcium sensitivity of glutamate release in a calyx-type terminal. Science 289:953–957. - PubMed
Publication types
MeSH terms
Substances
LinkOut - more resources
Full Text Sources
Miscellaneous
