Frequency-specific modulation of population-level frequency tuning in human auditory cortex - PubMed (original) (raw)
Frequency-specific modulation of population-level frequency tuning in human auditory cortex
Hidehiko Okamoto et al. BMC Neurosci. 2009.
Abstract
Background: Under natural circumstances, attention plays an important role in extracting relevant auditory signals from simultaneously present, irrelevant noises. Excitatory and inhibitory neural activity, enhanced by attentional processes, seems to sharpen frequency tuning, contributing to improved auditory performance especially in noisy environments. In the present study, we investigated auditory magnetic fields in humans that were evoked by pure tones embedded in band-eliminated noises during two different stimulus sequencing conditions (constant vs. random) under auditory focused attention by means of magnetoencephalography (MEG).
Results: In total, we used identical auditory stimuli between conditions, but presented them in a different order, thereby manipulating the neural processing and the auditory performance of the listeners. Constant stimulus sequencing blocks were characterized by the simultaneous presentation of pure tones of identical frequency with band-eliminated noises, whereas random sequencing blocks were characterized by the simultaneous presentation of pure tones of random frequencies and band-eliminated noises. We demonstrated that auditory evoked neural responses were larger in the constant sequencing compared to the random sequencing condition, particularly when the simultaneously presented noises contained narrow stop-bands.
Conclusion: The present study confirmed that population-level frequency tuning in human auditory cortex can be sharpened in a frequency-specific manner. This frequency-specific sharpening may contribute to improved auditory performance during detection and processing of relevant sound inputs characterized by specific frequency distributions in noisy environments.
Figures
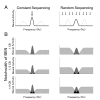
Figure 1
Models of population-level frequency tuning sharpness. Schematic models of population-level frequency tuning sharpness with respect to the constant sequencing (test stimulus (TS) with constant frequency; left column) and the random sequencing conditions (random TS frequency; right column). The arrows indicate the presented frequencies. 'Gain' size is represented as neural activity amplitude; degree of 'sharpening' corresponds to the width of the frequency band that effectively evokes neural activity. A: Neural activity corresponding to the TS frequency (thick line) and other frequencies (thin line). In the constant sequencing condition, the neural activity corresponding to the constant TS frequency is larger and frequency tuning is sharper compared to other frequencies, due to frequency-specific 'gain' and 'sharpening' effects. In contrast, in the random-sequencing condition, 'gain' and 'sharpening' effects are widely distributed across frequencies, resulting in identical frequency tuning sharpness for TS and non-TS frequencies. B: Neural activity elicited by TS and band-eliminated noises (BENs). Left and right columns represent the constant sequencing (Constant TS) and random sequencing (Random TS) conditions. The top, middle, and bottom rows represent wide (1 critical band (CB)), middle (1/2 CB), and narrow (1/4 CB) BEN conditions. The three differently colored areas represent three distinct neural groups: (i) neurons merely activated by BEN (light gray areas), (ii) neurons merely activated by TS (dark gray areas), and (iii) neurons activated by both BEN and TS (black areas). The dark gray areas correspond to N1m source strength elicited by TS-onset, since the neural activity represented by the light gray and black areas has been masked by the simultaneously presented (and earlier onsetting) BEN. Notably, the neural activity surrounding the TS frequency in the constant sequencing condition is larger and sharper due to the frequency-specific 'gain' and 'sharpening' effects, as shown in Figure 1A.
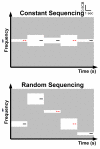
Figure 2
Experimental procedure. Concept and time course of the auditory stimulation with respect to the constant sequencing and random sequencing conditions. Pass-bands and stop-bands of the band-eliminated noises (BENs) are represented by the light gray and white areas, respectively. The notch-bandwidth of a BEN (white area) is either 1/4, 1/2, or 1 critical band. Target and non-target test stimuli (TS) are represented as red lines with gap (target TS, requiring a button press) and black lines without gap (non-target TS), respectively. During the constant sequencing condition (constant frequency: upper graph), TS has identical frequency, whereas during the random sequencing condition (random frequency: lower graph) TS has different frequencies (e.g., 250, 350, 450, 570, 700, 840, 1000, 1170, 1370, 1600, 1850, 2150, 2500, 2900, 3400, or 4000 Hz). The TS frequencies differed between constant sequencing blocks. In total, identical bottom-up auditory inputs are provided during the constant sequencing and random sequencing conditions. Exemplary sound files corresponding to constant sequencing and random sequencing conditions are available in Additional file 1.
Figure 3
Representative subject result. A: Averaged auditory evoked magnetic fields (30 Hz low-pass filtered) of one representative subject. The waveforms exhibit clear N1m responses peaking at the latency of 170 msec. B: Magnetic contour maps and estimated single dipoles at the latency of the maximal N1m response are illustrated together with skin and brain modelled from the individual MRI. Red and blue contour lines represent outbound and inbound flows of magnetic fields from and to the brain. The contour maps show clear dipolar patterns above the left and right auditory cortices. The spheres and barrels in the brain indicate the locations and orientations of single dipoles in left (green) and right (red) hemispheres. The larger N1m source strength in the left hemisphere is represented by the larger dipole size.
Figure 4
Grand averaged source strength waveforms. Mean N1m source strengths (N = 14) in left and right hemispheres, respectively. Solid lines represent the constant sequencing condition (CS), and dotted lines represent the random sequencing condition (RS). Each colour represents a band-eliminated noise (BEN) condition (blue: 1 critical band, green: 1/2 critical band, red: 1/4 critical band).
Figure 5
N1m source strength. Group means (N = 14) of the N1m source strengths in the left and in the right hemispheres for each experimental condition including error-bars denoting the 95% confidence limits of variables from the mean of all conditions in each hemisphere of each subject. Filled circles denote the N1m source strengths elicited by the test stimulus (TS) during the constant sequencing (Constant TS), and open circles denote the N1m source strengths during the random sequencing conditions (Random TS).
Figure 6
N1m latency. Group means (N = 14) of the N1m latencies including error bars (figure arrangement according to Figure 5).
Figure 7
Error rates and reaction times. Error rates (%) and reaction times (sec) as functions of BEN type including error bars (figure arrangement according to Figure 5).
Similar articles
- Attention improves population-level frequency tuning in human auditory cortex.
Okamoto H, Stracke H, Wolters CH, Schmael F, Pantev C. Okamoto H, et al. J Neurosci. 2007 Sep 26;27(39):10383-90. doi: 10.1523/JNEUROSCI.2963-07.2007. J Neurosci. 2007. PMID: 17898210 Free PMC article. - Bottom-up driven involuntary auditory evoked field change: constant sound sequencing amplifies but does not sharpen neural activity.
Okamoto H, Stracke H, Lagemann L, Pantev C. Okamoto H, et al. J Neurophysiol. 2010 Jan;103(1):244-9. doi: 10.1152/jn.00530.2009. Epub 2009 Nov 4. J Neurophysiol. 2010. PMID: 19889852 - Lipreading and covert speech production similarly modulate human auditory-cortex responses to pure tones.
Kauramäki J, Jääskeläinen IP, Hari R, Möttönen R, Rauschecker JP, Sams M. Kauramäki J, et al. J Neurosci. 2010 Jan 27;30(4):1314-21. doi: 10.1523/JNEUROSCI.1950-09.2010. J Neurosci. 2010. PMID: 20107058 Free PMC article. - Functional imaging of auditory scene analysis.
Gutschalk A, Dykstra AR. Gutschalk A, et al. Hear Res. 2014 Jan;307:98-110. doi: 10.1016/j.heares.2013.08.003. Epub 2013 Aug 19. Hear Res. 2014. PMID: 23968821 Review. - Modular organization of frequency integration in primary auditory cortex.
Schreiner CE, Read HL, Sutter ML. Schreiner CE, et al. Annu Rev Neurosci. 2000;23:501-29. doi: 10.1146/annurev.neuro.23.1.501. Annu Rev Neurosci. 2000. PMID: 10845073 Review.
Cited by
- Manipulation of Auditory Inputs as Rehabilitation Therapy for Maladaptive Auditory Cortical Reorganization.
Okamoto H. Okamoto H. Neural Plast. 2018 May 20;2018:2546250. doi: 10.1155/2018/2546250. eCollection 2018. Neural Plast. 2018. PMID: 29887880 Free PMC article. Review. - Hemispheric Asymmetry of Endogenous Neural Oscillations in Young Children: Implications for Hearing Speech In Noise.
Thompson EC, Woodruff Carr K, White-Schwoch T, Tierney A, Nicol T, Kraus N. Thompson EC, et al. Sci Rep. 2016 Jan 25;6:19737. doi: 10.1038/srep19737. Sci Rep. 2016. PMID: 26804355 Free PMC article. - Double-blind, randomized, placebo-controlled pilot clinical trial with gamma-band transcranial alternating current stimulation for the treatment of schizophrenia refractory auditory hallucinations.
Wang X, Zhang X, Chang Y, Liao J, Liu S, Ming D. Wang X, et al. Transl Psychiatry. 2025 Jan 30;15(1):36. doi: 10.1038/s41398-025-03256-z. Transl Psychiatry. 2025. PMID: 39885141 Free PMC article. Clinical Trial. - Task-related suppression of the brainstem frequency following response.
Hairston WD, Letowski TR, McDowell K. Hairston WD, et al. PLoS One. 2013;8(2):e55215. doi: 10.1371/journal.pone.0055215. Epub 2013 Feb 18. PLoS One. 2013. PMID: 23441150 Free PMC article. - Bottom-up driven involuntary attention modulates auditory signal in noise processing.
Lagemann L, Okamoto H, Teismann H, Pantev C. Lagemann L, et al. BMC Neurosci. 2010 Dec 30;11:156. doi: 10.1186/1471-2202-11-156. BMC Neurosci. 2010. PMID: 21192798 Free PMC article.
References
- Ross B, Picton TW, Herdman AT, Pantev C. The effect of attention on the auditory steady-state response. Neurol Clin Neurophysiol. 2004;2004:22. - PubMed
Publication types
MeSH terms
LinkOut - more resources
Full Text Sources
Other Literature Sources


