Use of a synthetic salicylic acid analog to investigate the roles of methyl salicylate and its esterases in plant disease resistance - PubMed (original) (raw)
Use of a synthetic salicylic acid analog to investigate the roles of methyl salicylate and its esterases in plant disease resistance
Sang-Wook Park et al. J Biol Chem. 2009.
Abstract
We previously demonstrated that salicylic acid-binding protein 2 (SABP2) of tobacco is an integral component of systemic acquired resistance (SAR). SABP2 is a methyl salicylate (MeSA) esterase that has high affinity for SA, which feedback inhibits its esterase activity. MeSA esterase activity is required in distal, healthy tissue of pathogen-infected plants to hydrolyze MeSA, which functions as a long-distance, phloem-mobile SAR signal; this hydrolysis releases the biologically active defense hormone SA. In this study, we examined the inhibitory interaction of SA with SABP2, and identified a synthetic SA analog, 2,2,2,2'-tetra-f luoroacetophenone (tetraFA) that, like SA, competitively inhibits the activity of SABP2 and targets esterases, which utilize MeSA as a substrate. However, in contrast to SA, tetraFA does not induce downstream defense responses and, therefore, is effective in planta at blocking SAR development in tobacco mosaic virus (TMV)-infected tobacco and Pseudomonas syringae-infected Arabidopsis. These results confirm the importance of SABP2 and MeSA for SAR development in tobacco and establish similar roles for MeSA and the orthologs of SABP2 in Arabidopsis. Moreover, they demonstrate that tetraFA can be used to determine whether MeSA and its corresponding esterase(s) play a role in SAR signaling in other plant species. In planta analyses using tetraFA, in conjunction with leaf detachment assays and MeSA quantification, were used to assess the kinetics with which MeSA is generated in pathogen-infected leaves, transmitted through the phloem, and processed in the distal healthy leaves. In TMV-infected tobacco, these studies revealed that critical amounts of MeSA are generated, transmitted, and processed between 48 and 72 h post primary infection.
Figures
FIGURE 1.
Inhibition of the MeSA esterase activity of SABP2 by SA. Lines represent the global fit of all data (n = 3) to the equation for competitive inhibition. Initial velocities were determined as described under “Experimental Procedures” at 0 μ
m
(open circles), 1 μ
m
(open squares), 2.5 μ
m
(open triangles), 5 μ
m
(closed circles), 10 μ
m
(closed squares), and 50 μ
m
(closed triangles) SA.
FIGURE 2.
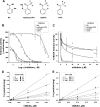
Inhibition of the esterase activity of SABP2 by FAs. A, structure of SA and the FAs. B and C, inhibitory activities of SA (open circles), tetraFA (open triangles), triFA (open diamond), and methoxy-triFA (open squares) toward the general esterase activity of SABP2, using 1 m
m
_p_NP-butyrate (C4) as the substrate (B), or toward MeSA esterase activity, using 0.1 m
m
MeSA as the substrate (C). D and E, double-reciprocal plots of the effects of tetraFA (D) or triFA (E) on the MeSA esterase activity of SABP2. Lines represent the global fit of all data (n = 3) to the equation for competitive inhibition. Initial velocities were determined as described under “Experimental Procedures” at 0 m
m
(open circles), 0.01 m
m
(open squares), 0.05 m
m
(open triangles), 0.1 m
m
(closed circles), 0.5 m
m
(closed squares), and 1 m
m
(closed triangles) FA.
FIGURE 3.
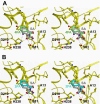
Model of the active-site pocket of SABP2 and the binding modes of FAs compared with SA. The binding modes of SA (gray), tetraFA (green, A), and triFA (blue, B) in the active site of SABP2 are depicted; the catalytic triad residues (Ser81, Asp210 and His238) and Ala13 are noted, and the hydrogen bonds are indicated as dashed lines.
FIGURE 4.
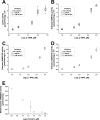
Specific inactivation of MeSA esterases by tetraFA. The effects of tetraFA and SA on the activities of P. miehei lipase (A), AtMES3 (B), AtMES10 (C), AtMES16 (D), and AtMES9 (E). A-D, the assays for lipase and esterase activity were performed utilizing _p_NP-myristate (C14; A) or_pNP_-butyrate (C4; _B_-D), respectively, as a substrate in the absence of an inhibitor (open circles) or in the presence of 1 m
m
inhibitor, SA (open squares) or tetraFA (open triangles). E, inhibition of the esterase activity of AtMES9 by tetraFA was determined using 0.25 m
m
MeSA as the substrate.
FIGURE 5.
TetraFA blocks SAR development in TMV-infected tobacco. Induced plants received a 1° inoculation of TMV on the three lower leaves per plant to activate SAR, whereas uninduced plants received a mock 1° inoculation with 10 m
m
HEPES (pH 7.0) buffer. At 48 and 72 hp1°i, distal leaves were treated with 1 m
m
tetraFA or buffer. Six days post 1° TMV infection (dp1°i), these distal leaves were challenged by a 2° TMV infection. The size of lesions was measured (in mm ± S.D.) and photographed at 5 days post 2° infection.N/A, not applicable. Reduction (%), percent reduction in the size of 2° TMV lesions formed on induced_versus_ uninduced plants.
FIGURE 6.
TetraFA blocks SAR in Arabidopsis. SAR was analyzed in mock-inoculated (white bars) and avirulent Psm AvrRpt2-infected (striped bars) wild type Col-0 plants. After 1° infection, 10 m
m
HEPES buffer (pH 7.0) with 0, 2, 10, or 20 m
m
tetraFA was applied to distal leaves by repeated spraying at 3, 24, and 48 hp1°i. Distal leaves were infected at 72 hp1oi with virulent Pst DC3000 and titers of bacteria in the distal challenged tissue were determined at 3 days post 2° infection.
FIGURE 7.
The MeSA esterase activity of SABP2 is required in distal leaves between 48 and 72 hp1°i for SAR development. A, schematic design for the time course of tetraFA (1 m
m
) application. Control leaf (con.) received a buffer (10 m
m
HEPES, pH 7.0) treatment without tetraFA at 48 hp1°i. B, determination of lesion sizes in millimeters on the distal leaves at 5 days post 2° infection. Uninduced plants were mock inoculated on the three lower leaves, whereas induced plants received TMV inoculation on three lower leaves 6 days prior to 2° TMV infection. % red., percent reduction in the size of 2° TMV lesions formed on induced versus uninduced plants. C, photographs of TMV-induced lesions on distal leaves described in B at 5 days post 2° infection. Note induced plants without tetraFA treatment were used as a positive control for SAR (right column). D, RNA-blot analysis of TMV coat protein (CP) transcripts in the distal leaves, at 0 and 4 days post 2° infection, of plants received tetraFA treatment at various times after 1° infection. Five μg of total RNA were loaded per lane and ethidium bromide-stained ribosomal RNA (rRNA) was used as a loading control.
FIGURE 8.
SABP2 activity in distal leaves is essential between 48 and 72 hp1°i, regardless of leaf position. A, schematic design for_in planta_ tetraFA treatment (1 m
m
) of various leaves at different time points. Control leaf (con.) received a buffer treatment without tetraFA at 48 hp1°i. B, determination of lesion sizes in millimeters on the distal leaves at 5 days post 2° infection. All plants received a 1° TMV inoculation on three lower leaves. At the specified times post 1° infection, leaves at different positions were treated with buffer or tetraFA. Six days post 1° infection, the buffer- or tetraFA-treated distal leaves received a 2° TMV infection. %red., percent reduction in size of 2° versus 1° lesions on plants that received either buffer or tetraFA treatment.
FIGURE 9.
Kinetics of SAR signal movement from 1° infected leaves and MeSA levels in phloem/petiole exudates of these leaves. A and_B_, SAR development was affected by the time at which TMV-infected leaves were detached. Primary inoculated leaves were detached from plants at the times indicated and the distal leaves were challenged with TMV at 6 days post 1° infection. Uninduced plants were mock inoculated on the lower leaves, which were not excised from plants. Control plants (con.) in_B_, which did not have their 1° TMV infected leaves detached prior to 2° TMV infection, exhibited the usual level of % reduction (red.) of size of 2° lesions versus size of 2° lesions on plants receiving a mock 1° inoculation. N/A, not applicable. C, levels of MeSA in petiole exduates of detached 1° TMV infected leaves from A.
Similar articles
- Methyl salicylate is a critical mobile signal for plant systemic acquired resistance.
Park SW, Kaimoyo E, Kumar D, Mosher S, Klessig DF. Park SW, et al. Science. 2007 Oct 5;318(5847):113-6. doi: 10.1126/science.1147113. Science. 2007. PMID: 17916738 - Methyl esterase 1 (StMES1) is required for systemic acquired resistance in potato.
Manosalva PM, Park SW, Forouhar F, Tong L, Fry WE, Klessig DF. Manosalva PM, et al. Mol Plant Microbe Interact. 2010 Sep;23(9):1151-63. doi: 10.1094/MPMI-23-9-1151. Mol Plant Microbe Interact. 2010. PMID: 20687805 - Identification of likely orthologs of tobacco salicylic acid-binding protein 2 and their role in systemic acquired resistance in Arabidopsis thaliana.
Vlot AC, Liu PP, Cameron RK, Park SW, Yang Y, Kumar D, Zhou F, Padukkavidana T, Gustafsson C, Pichersky E, Klessig DF. Vlot AC, et al. Plant J. 2008 Nov;56(3):445-56. doi: 10.1111/j.1365-313X.2008.03618.x. Epub 2008 Jul 9. Plant J. 2008. PMID: 18643994 - Signals of Systemic Immunity in Plants: Progress and Open Questions.
Ádám AL, Nagy ZÁ, Kátay G, Mergenthaler E, Viczián O. Ádám AL, et al. Int J Mol Sci. 2018 Apr 10;19(4):1146. doi: 10.3390/ijms19041146. Int J Mol Sci. 2018. PMID: 29642641 Free PMC article. Review. - The role of methyl salicylate in plant growth under stress conditions.
Gondor OK, Pál M, Janda T, Szalai G. Gondor OK, et al. J Plant Physiol. 2022 Oct;277:153809. doi: 10.1016/j.jplph.2022.153809. Epub 2022 Sep 8. J Plant Physiol. 2022. PMID: 36099699 Review.
Cited by
- UV-C-irradiated Arabidopsis and tobacco emit volatiles that trigger genomic instability in neighboring plants.
Yao Y, Danna CH, Zemp FJ, Titov V, Ciftci ON, Przybylski R, Ausubel FM, Kovalchuk I. Yao Y, et al. Plant Cell. 2011 Oct;23(10):3842-52. doi: 10.1105/tpc.111.089003. Epub 2011 Oct 25. Plant Cell. 2011. PMID: 22028460 Free PMC article. - Structure-function relationship of a citrus salicylate methylesterase and role of salicylic acid in citrus canker resistance.
Lima Silva CC, Shimo HM, de Felício R, Mercaldi GF, Rocco SA, Benedetti CE. Lima Silva CC, et al. Sci Rep. 2019 Mar 7;9(1):3901. doi: 10.1038/s41598-019-40552-3. Sci Rep. 2019. PMID: 30846791 Free PMC article. - Salicylic acids: local, systemic or inter-systemic regulators?
Hayat S, Irfan M, Wani AS, Alyemeni MN, Ahmad A. Hayat S, et al. Plant Signal Behav. 2012 Jan;7(1):93-102. doi: 10.4161/psb.7.1.18620. Plant Signal Behav. 2012. PMID: 22301975 Free PMC article. Review. - Comparative Transcriptome Analysis Reveals Differential Gene Expression in Resistant and Susceptible Watermelon Varieties in Response to Meloidogyne incognita.
Zhu Y, Yuan G, Zhao R, An G, Li W, Si W, Liu J, Sun D. Zhu Y, et al. Life (Basel). 2022 Jul 6;12(7):1003. doi: 10.3390/life12071003. Life (Basel). 2022. PMID: 35888092 Free PMC article. - The extent to which methyl salicylate is required for signaling systemic acquired resistance is dependent on exposure to light after infection.
Liu PP, von Dahl CC, Klessig DF. Liu PP, et al. Plant Physiol. 2011 Dec;157(4):2216-26. doi: 10.1104/pp.111.187773. Epub 2011 Oct 21. Plant Physiol. 2011. PMID: 22021417 Free PMC article.
References
- Durrant, W. E., and Dong, X. (2004) Annu. Rev. Phytopathol. 42 185-209 - PubMed
- Hoffmann, J. A., Kafatos, F. C., Janeway, C. A., and Ezekowitz, R. A. (1999) Science 284 1313-1318 - PubMed
- Aderem, A., and Underhill, D. M. (1999) Annu. Rev. Immunol. 17 593-623 - PubMed
- Jones, J. D., and Dangl, J. L. (2006) Nature 444 323-329 - PubMed
- Ausubel, F. M. (2005) Nat. Immunol. 6 973-979 - PubMed
Publication types
MeSH terms
Substances
LinkOut - more resources
Full Text Sources
Molecular Biology Databases
Miscellaneous


