Sgt1, a co-chaperone of Hsp90 stabilizes Polo and is required for centrosome organization - PubMed (original) (raw)
Sgt1, a co-chaperone of Hsp90 stabilizes Polo and is required for centrosome organization
Torcato Martins et al. EMBO J. 2009.
Abstract
Sgt1 was described previously in yeast and humans to be a Hsp90 co-chaperone and required for kinetochore assembly. We have identified a mutant allele of Sgt1 in Drosophila and characterized its function. Mutations in sgt1 do not affect overall kinetochore assembly or spindle assembly checkpoint. sgt1 mutant cells enter less frequently into mitosis and arrest in a prometaphase-like state. Mutations in sgt1 severely compromise the organization and function of the mitotic apparatus. In these cells, centrioles replicate but centrosomes fail to mature, and pericentriolar material components do not localize normally resulting in highly abnormal spindles. Interestingly, a similar phenotype was described previously in Hsp90 mutant cells and correlated with a decrease in Polo protein levels. In sgt1 mutant neuroblasts, we also observe a decrease in overall levels of Polo. Overexpression of the kinase results in a substantial rescue of the centrosome defects; most cells form normal bipolar spindles and progress through mitosis normally. Taken together, these findings suggest that Sgt1 is involved in the stabilization of Polo allowing normal centrosome maturation, entry and progression though mitosis.
Figures
Figure 1
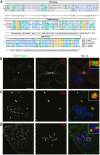
Identification of Sgt1 in Drosophila and cellular localization in S2 cells. (A) Sequence homology between Sgt1 proteins from different species. The conserved domains are indicated in boxes; tetracopeptide domain (TPR domain), p23-like CHORD domain and Sgt1-specific domain (SGS domain). (B–D) Localization of EGFP–Sgt1 in S2 cells. (B) In asynchronous cells, EGFP–Sgt1 (green) can be detected only at the cleavage furrow during late mitosis as shown by the co-staining with α-tubulin (red). When cells are treated with colchicine, we can observe (C) accumulation of EGFP–Sgt1 (green) at the centrosomes identified by γ-tubulin (red) and (D) at the outer region of the kinetochores as shown by co-staining with the centromeric marker CID (red). For all immunolocalization, DNA was stained with DAPI (blue). Scale bar, 5 μm.
Figure 2
Identification and characterization of sgt1 P1 alleles. (A) Diagram showing the TE element insertion in gene CG9617 of the mutant strain _sgt1_P1. (B) Western blot of total protein extracts from control and _sgt1_P1 neuroblasts probed for Sgt1 and α-tubulin, as a loading control. (C) Cytological analysis of mitotic progression of control (w1118) and mutant (_sgt1_P1/_sgt1_P1) third instar larval neuroblasts. Insets in the central panels highlight the chromosome hypercondensation phenotype. (D) Quantification of mitotic parameters in control and mutant neuroblasts in the absence and presence of colchicine (_n_=10 brains for each condition, and 2000 cells scored). (E) Quantification of mitotic progression in wild-type and _sgt1_P1 neuroblasts (_n_=10 brains for each condition, and 100 mitotic figures scored). (F) Quantification of prometaphase phenotype in neuroblasts (_n_=12 brains for each condition, and 100 prometaphases scored). Not statistically significant (NS); or significantly different: P<0.01 (**) and P<0.001 (***); scale bar, 5 μm.
Figure 3
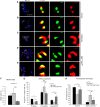
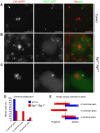
The SAC in _sgt1_P1 neuroblasts. Immunofluorescence localization of SAC proteins BubR1 and Bub3 in (A–C) control or (D, E) _sgt1_P1 neuroblasts. In the merged image, DNA (blue) is shown, and in the panels on the right, the kinetochores (white box in the merged image) are shown at a higher magnification. Anti-Polo antibody was used as control, but the signal had to be intensified in _sgt1_P1 due to the low level of this protein at the kinetochore. During prometaphase (A, B, D, E) control cells show clearly defined localization of both BubR1 and Bub3, but in mutant cells, both proteins show a broad distribution resembling the distribution of BubR1 in (C) control cells when incubated with colchicine. (F) Quantification of the mitotic index in control, _sgt1_P1 and _sgt1_P1;_bub3_1 double-mutant neuroblasts. Note that in the double mutant cells, the mitotic index is significantly reduced, indicative of the loss of SAC activity (_n_=10 brains for each condition, and 2000 cells scored) (G) Quantification of mitotic progression in control, _sgt1_P1 and _sgt1_P1;_bub3_1 double-mutant neuroblasts. (_n_=10 brains for each condition, and 100 mitotic figures scored) (H) Quantification prometaphase with hypercondensed chromosomes in control, _sgt1_P1 and _sgt1_P1;_bub3_1 double-mutant neuroblasts (_n_=12 brains for each condition, where 100 prometaphases were quantified). Not statistically significant (NS); or significantly different: P<0.05 (*), P<0.01 (**) and P<0.001 (***); Scale bar, 5 μm.
Figure 4
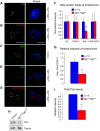
Analysis of cell cycle progression in control and sgt1 P1 neuroblasts. (A) Brains were dissected from control or _sgt1_P1 mutant larvae and immunostained to reveal cyclin B and counterstained for DNA. (B) Quantification of the number of cyclin B-positive cells in either control or mutant brains. (C) High magnification of a random area from either control or mutant larvae showing BrdU and DNA. (D) Quantification of BrdU-positive cells in relation to the total number of cells. Difference not statistically significant (NS); or significantly different: P<0.01 (**) and P<0.001 (***); scale bar, 50 μm.
Figure 5
Organization of the kinetochore in the absence of Sgt1. Immunolocalization of different kinetochore proteins in (A, B, D, E) _sgt1_P1 or (C) control neuroblasts. In the merged images CID and Polo (green), CENP-E and CENP-meta (red) and DNA (blue) are shown. Note reduced Polo signal in _sgt1_P1 when compared with control neuroblasts. (F) Quantification of the signal intensity of Cid, CENP-C, Polo and CENP-META at kinetochores in both control and _sgt1_P1 neuroblasts. The prometaphase cells were randomly selected and the intensities of kinetochore proteins in the sgt1 mutant cells were normalized to the average in control cells. All images were acquired using identical parameters. (G) Quantification of the ratio between kinetochore levels of Polo and CENP-C in control and _sgt1_P1 neuroblasts. (H) Western blot of total protein extracts from control or _sgt1_P1 neuroblasts and (I) quantification of the signal showing a significant reduction in Polo protein levels in mutant brains. α-tubulin was used as a loading control. (For all the quantifications, _n_=200 kinetochores from five different preparations in each condition and 20 cells scored). Significantly different: P<0.001 (***); scale bar, 5 μm.
Figure 6
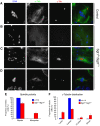
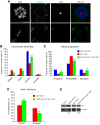
Organization of the mitotic apparatus in the absence of Sgt1. (A) Control and (B–D) _sgt1_P1 neuroblasts were immunostained to show spindle microtubules (α-tubulin in green), centrosomes (γ-tubulin in red) and DNA (blue). (A) Control cells showing a normal mitotic spindle with γ-tubulin staining at both poles. Mutant cells show many spindle abnormalities including (B) monopolar spindles with a diffuse staining of γ-tubulin, (C) monopolar spindles with only one centrosome or (D) bipolar spindles with more than two defined spots of γ-tubulin staining. (E) Quantification of spindle organization. (F) Quantification of MTOCs with centrosomes as ascertained by γ-tubulin staining (in all the conditions, _n_=8 brains); scale bar, 5 μm.
Figure 7
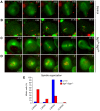
Live imaging of control and mutant neuroblasts. Primary cultures of neuroblasts were imaged by time-lapse spinning confocal microscopy to visualize spindle microtubules (GFP–α-tubulin in green) and the centromeres (Cid–mRFP in red). (A) Wild-type cell showing two microtubule asters at opposite poles of a well-organized bipolar spindle with centromeres congressing and then separating during anaphase. (B) _sgt1_P1 cell showing a spindle without asters and microtubules that appears to be nucleated from the chromosomes that remains in mitosis for at least 1 h after NEB. (C) _sgt1_P1 cell with a spindle organized from a single MTOC that is able to enter anaphase after a delay of 35 min in metaphase. (D) _sgt1_P1 cell showing a multipolar spindle that remained in prometaphase for at least 60 min. (*) This cell was filmed in prometaphase therefore the time of NEB could not be determined. (E) Distribution of the spindle organization observed after in vivo analysis. The number of MTOCs was determined by the presence of asters at the poles of the mitotic spindle (control _n_=65 cells; _sgt1_P1 _n_=192). Scale bar, 5 μm.
Figure 8
Determination of centriole numbers in _sgt1_P1 mutant cells. In vivo analysis of the centrioles was carried out using PACT–GFP and the centromeric marker Cid–mRFP. (A) Wild-type neuroblast showing two well-defined centriolar spots (arrows) at opposite sides of the metaphase plate. (B) _sgt_P1 mutant neuroblast showing irregular number of centrioles (arrows), two on one side and a single pair on the other side of the cluster of centromeres. (C) Polyploid cell from an _sgt_P1 mutant brain showing a cluster of centrioles (arrow) in one side of the large centromere cluster. (D) Quantification of the number of centrioles in control and mutant neuroblasts. (E) Quantification of cellular ploidy and the number of centrioles in control and mutant neuroblasts (control _n_=40; _sgt1_P1 _n_=121 cells). Scale bar, 5 μm.
Figure 9
Overexpression of Polo in _sgt1_P1 and wild-type neuroblasts. (A) CNN and α-tubulin staining of neuroblasts in which Polo was overexpressed, using the daGAL4 driver (daGAL4:UAS-Polo; _sgt1_P1/_sgt1_P1). The top panel shows a cell with a monopolar spindle similar to those observed in _sgt_P1/_sgt_P1 homozygote, with one well-defined pole with strong staining of CNN. In the bottom panel, a typical Polo-overexpressing cell showing a bipolar spindle similar to controls with one defined spot of CNN at each pole. (B) Quantification of the CNN distribution in both control (daGAL4:UAS-Polo; +/+), _sgt1_P1 mutant (_sgt1_P1/_sgt1_P1) and Sgt1 mutant overexpressing Polo (daGAL4:UAS-Polo; _sgt1_P1/_sgt1_P1) (_n_=10 brains). (C) Quantification of mitotic progression in control (daGAL4:UAS-Polo; +/+), _sgt1_P1/_sgt1_P1 and Sgt1 mutant overexpressing Polo (daGAL4:UAS-Polo; _sgt1_P1/_sgt1_P1) (_n_=10 brains). (D) Quantification of the number of cells showing enlarged BubR1 kinetochore accumulation in either Sgt1 mutant (_sgt1_P1/_sgt1_P1) and Sgt1 mutant overexpressing Polo (daGAL4:UAS-Polo; _sgt1_P1/_sgt1_P1) neuroblasts. Normal staining indicates a dot-like BubR1 accumulation, whereas enlarged staining indicates cells that have more than 50% of their kinetochores with BubR1 staining similar to kinetochores of wild-type cells treated with colchicine (_n_=5 different brains and 200 cells scored). (E) Western blot and quantification of Polo protein levels in the different genotypes. Not statistically significant (NS); or significantly different: P<0.05 (*), P<0.01 (**) and P<0.001 (***); all statistically significant differences correspond to comparisons between _sgt1_P1/_sgt1_P1 and daGAL4:UAS-Polo; _sgt1_P1/_sgt1_P1 strains. Scale bar, 5 μm.
Similar articles
- Plk1/Polo Phosphorylates Sas-4 at the Onset of Mitosis for an Efficient Recruitment of Pericentriolar Material to Centrosomes.
Ramani A, Mariappan A, Gottardo M, Mandad S, Urlaub H, Avidor-Reiss T, Riparbelli M, Callaini G, Debec A, Feederle R, Gopalakrishnan J. Ramani A, et al. Cell Rep. 2018 Dec 26;25(13):3618-3630.e6. doi: 10.1016/j.celrep.2018.11.102. Cell Rep. 2018. PMID: 30590037 - Mutations in Drosophila Greatwall/Scant reveal its roles in mitosis and meiosis and interdependence with Polo kinase.
Archambault V, Zhao X, White-Cooper H, Carpenter AT, Glover DM. Archambault V, et al. PLoS Genet. 2007 Nov;3(11):e200. doi: 10.1371/journal.pgen.0030200. PLoS Genet. 2007. PMID: 17997611 Free PMC article. - Cdk1 Phosphorylates Drosophila Sas-4 to Recruit Polo to Daughter Centrioles and Convert Them to Centrosomes.
Novak ZA, Wainman A, Gartenmann L, Raff JW. Novak ZA, et al. Dev Cell. 2016 Jun 20;37(6):545-57. doi: 10.1016/j.devcel.2016.05.022. Dev Cell. 2016. PMID: 27326932 Free PMC article. - Polar expeditions--provisioning the centrosome for mitosis.
Blagden SP, Glover DM. Blagden SP, et al. Nat Cell Biol. 2003 Jun;5(6):505-11. doi: 10.1038/ncb0603-505. Nat Cell Biol. 2003. PMID: 12776127 Review. - Polo kinase and progression through M phase in Drosophila: a perspective from the spindle poles.
Glover DM. Glover DM. Oncogene. 2005 Jan 10;24(2):230-7. doi: 10.1038/sj.onc.1208279. Oncogene. 2005. PMID: 15640838 Review.
Cited by
- Cell Cycle Kinase Polo Is Controlled by a Widespread 3' Untranslated Region Regulatory Sequence in Drosophila melanogaster.
Oliveira MS, Freitas J, Pinto PAB, de Jesus A, Tavares J, Pinho M, Domingues RG, Henriques T, Lopes C, Conde C, Sunkel CE, Moreira A. Oliveira MS, et al. Mol Cell Biol. 2019 Jul 16;39(15):e00581-18. doi: 10.1128/MCB.00581-18. Print 2019 Aug 1. Mol Cell Biol. 2019. PMID: 31085682 Free PMC article. - Interplay between the phosphatase PHLPP1 and E3 ligase RNF41 stimulates proper kinetochore assembly via the outer-kinetochore protein SGT1.
Gangula NR, Maddika S. Gangula NR, et al. J Biol Chem. 2017 Aug 25;292(34):13947-13958. doi: 10.1074/jbc.M117.782896. Epub 2017 Jul 10. J Biol Chem. 2017. PMID: 28696259 Free PMC article. - Hsp83/Hsp90 Physically Associates with Insulin Receptor to Promote Neural Stem Cell Reactivation.
Huang J, Wang H. Huang J, et al. Stem Cell Reports. 2018 Oct 9;11(4):883-896. doi: 10.1016/j.stemcr.2018.08.014. Epub 2018 Sep 20. Stem Cell Reports. 2018. PMID: 30245208 Free PMC article. - Gamma-tubulin is required for bipolar spindle assembly and for proper kinetochore microtubule attachments during prometaphase I in Drosophila oocytes.
Hughes SE, Beeler JS, Seat A, Slaughter BD, Unruh JR, Bauerly E, Matthies HJ, Hawley RS. Hughes SE, et al. PLoS Genet. 2011 Aug;7(8):e1002209. doi: 10.1371/journal.pgen.1002209. Epub 2011 Aug 11. PLoS Genet. 2011. PMID: 21852952 Free PMC article. - Topoisomerase II is required for the proper separation of heterochromatic regions during Drosophila melanogaster female meiosis.
Hughes SE, Hawley RS. Hughes SE, et al. PLoS Genet. 2014 Oct 23;10(10):e1004650. doi: 10.1371/journal.pgen.1004650. eCollection 2014 Oct. PLoS Genet. 2014. PMID: 25340780 Free PMC article.
References
- Catlett MG, Kaplan KB (2006) Sgt1p is a unique co-chaperone that acts as a client adaptor to link Hsp90 to Skp1p. J Biol Chem 281: 33739–33748 - PubMed
- Chintapalli VR, Wang J, Dow JA (2007) Using FlyAtlas to identify better Drosophila melanogaster models of human disease. Nat Genet 39: 715–720 - PubMed
Publication types
MeSH terms
Substances
LinkOut - more resources
Full Text Sources
Molecular Biology Databases
Miscellaneous
