An RNA code for the FOX2 splicing regulator revealed by mapping RNA-protein interactions in stem cells - PubMed (original) (raw)
An RNA code for the FOX2 splicing regulator revealed by mapping RNA-protein interactions in stem cells
Gene W Yeo et al. Nat Struct Mol Biol. 2009 Feb.
Abstract
The elucidation of a code for regulated splicing has been a long-standing goal in understanding the control of post-transcriptional gene expression events that are crucial for cell survival, differentiation and development. We decoded functional RNA elements in vivo by constructing an RNA map for the cell type-specific splicing regulator FOX2 (also known as RBM9) via cross-linking immunoprecipitation coupled with high-throughput sequencing (CLIP-seq) in human embryonic stem cells. The map identified a large cohort of specific FOX2 targets, many of which are themselves splicing regulators, and comparison between the FOX2 binding profile and validated splicing events revealed a general rule for FOX2-regulated exon inclusion or skipping in a position-dependent manner. These findings suggest that FOX2 functions as a critical regulator of a splicing network, and we further show that FOX2 is important for the survival of human embryonic stem cells.
Figures
Figure 1
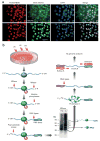
CLIP-seq of FOX2 in hESCs. (a) FOX2 is expressed in hESCs positive for pluripotent markers such as cytoplasmic SSEA4 and nuclear OCT4. Nuclei indicated by DAPI staining. (b) Flow chart of CLIP-Seq. RNA in complex with RNA binding proteins from UV-irradiated HUES6 hESCs was subjected to enrichment using anti-FOX2 rabbit polyclonal antibody. RNA in the complex was trimmed by MNase at two different concentrations, followed by autoradiography, as illustrated. Protein-RNA covalent complexes corresponding to bands A and B were recovered following SDS-PAGE, RT-PCR amplified and sequenced by the Illumina 1G genome analyzer.
Figure 2
Genomic mapping and analysis of FOX2 CLIP-seq reads. (a) Consensus in vivo FOX2 binding sites identified by CLIP-seq. Histogram of _Z_-scores indicating the enrichment of hexamers in CLIP-seq clusters compared to randomly chosen regions of similar sizes in the same genes. _Z_-scores of the top five hexamers were indicated. (b) Enrichment of FOX2 CLIP-seq clusters within both constitutive and regulated exons and flanking intronic regions, particularly in the 3′ half of exons and downstream intronic regions. The FOX2 CLIP-seq clusters mapped most frequently to alternative conserved exons (ACEs) predicted by ACEScan, followed by EST-verified AS exons (EST-AS), compared to constitutively spliced exons (CS). Randomly chosen regions of similar sizes in the same genes were not distributed near EST-AS exons (EST-AS, random) and CS exons (CS, random). The x axis indicates a composite intron-exon-intron structure, containing sequences from 2,000 nt in the upstream intron and the first 50 nt of the exon (left), and the last 50 nt of the exon and 2,000 nt in the downstream intron (right). The y axis indicates the frequency of FOX2 CLIP-seq clusters. (c) Sequence conservation of FOX2 CLIP-seq clusters associated with different classes of exons. The average Phastcons scores were used to compute the extent of conservation.
Figure 3
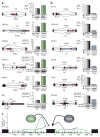
Clustering of FOX2 CLIP-seq reads around regulated splicing events. (a–d) The distribution of FOX2 CLIP-seq clusters in four examples of FOX2-regulated genes. The CLIP-seq reads are shown above each gene, with the y axis indicating the read density at each position. Each gene is diagrammed by vertical black bars (exons) and thin horizontal lines (introns), with arrows representing specific RT-PCR primers. Identified clusters are marked by horizontal orange bars. Exons encased by the red box in each case are illustrated in an expanded view below in which yellow boxes indicate the location of conserved GCAUG (dashed outlines) and UGCAUG (filled outlines) FOX2 binding motifs. Sequence conservation as measured by Phastcons scores is shown below. The insert in each expanded view shows RT-PCR analysis of alternative splicing in response to FOX2 knockdown by shRNA from triplicate experiments, with a representative gel image and s.d. indicated by error bars. FW, RV1 and RV2 represent forward and reverse primers. Ctl, control.
Figure 4
RNA map of FOX2-regulated alternative splicing. (a) FOX2-dependent exon skipping. (b) FOX2-dependent exon inclusion. Each gene is diagrammed by vertical black bars (exons) and thin horizontal lines (introns) with arrows representing specific RT-PCR primers. The conserved GCAUG FOX2 binding motifs (red vertical bars) generally overlap with mapped FOX2 binding sites by CLIP-seq (blue horizontal bars). Regulated splicing in control (Ctl) shRNA–and FOX2 (FOX2) shRNA–treated hESCs was analyzed by RT-PCR in triplicate, and s.d. is indicated by error bars. Changes in alternative splicing were significant in all cases, as determined by the Student’s _t_-test (_P_-value < 0.05). (c) Number of conserved GCAUG sites proximal to the RT-PCR–validated FOX2-regulated alternative splicing, showing that conserved FOX2 binding motifs upstream or downstream of the alternative exon correlate with FOX2-dependent exon skipping (green) or inclusion (blue), respectively. Dashed lines and error bars indicate average number and s.d. of GCAUG sites in 100 independent versions of shuffled CLIP-seq binding sites.
Figure 5
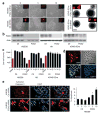
FOX2 is important for hESC survival. (a) Left, HUES6 hESC cells underwent rapid cell death in a dosage-dependent manner (2 μl, 5 μl and 10 μl) in response to FOX2 knockdown by lentiviral shRNA. Lentiviruses also expressed RFP, indicated in the inset, demonstrating the extent of infection. Right, similar infection of hCNS-SCns (grown as suspended neurospheres) did not result in a cell-death phenotype. Scale bars for hESC and hCNS-SCns are 25 μm and 200 μm, respectively. (b) Efficient FOX2 knockdown determined by western blotting was achieved in all cell types using actin as a loading control. (c) Cell counts using trypan blue exclusion indicates that the cell-death phenotype from FOX2 knockdown is specific to hESCs (HUES6 and H9 lines) and occurs in a dose-dependent fashion. (d) Infection of hESCs with FOX2 shRNA–RFP virus does not affect expression of pluripotency markers OCT4 and Nanog. (e) Knockdown of FOX2 in hESCs resulted in an increase in apoptotic cell death, as indicated by immunocytochemistry toward activated caspase-3 (left) and by FACs analysis using Yo-Pro (right) (* _P_-value < 0.001). Error bars indicate s.d.
Similar articles
- hnRNP H and hnRNP F complex with Fox2 to silence fibroblast growth factor receptor 2 exon IIIc.
Mauger DM, Lin C, Garcia-Blanco MA. Mauger DM, et al. Mol Cell Biol. 2008 Sep;28(17):5403-19. doi: 10.1128/MCB.00739-08. Epub 2008 Jun 23. Mol Cell Biol. 2008. PMID: 18573884 Free PMC article. - An RNA Switch of a Large Exon of Ninein Is Regulated by the Neural Stem Cell Specific-RNA Binding Protein, Qki5.
Hayakawa-Yano Y, Yano M. Hayakawa-Yano Y, et al. Int J Mol Sci. 2019 Feb 26;20(5):1010. doi: 10.3390/ijms20051010. Int J Mol Sci. 2019. PMID: 30813567 Free PMC article. - Cancer-associated regulation of alternative splicing.
Venables JP, Klinck R, Koh C, Gervais-Bird J, Bramard A, Inkel L, Durand M, Couture S, Froehlich U, Lapointe E, Lucier JF, Thibault P, Rancourt C, Tremblay K, Prinos P, Chabot B, Elela SA. Venables JP, et al. Nat Struct Mol Biol. 2009 Jun;16(6):670-6. doi: 10.1038/nsmb.1608. Epub 2009 May 17. Nat Struct Mol Biol. 2009. PMID: 19448617 - RBFOX2 protein domains and cellular activities.
Arya AD, Wilson DI, Baralle D, Raponi M. Arya AD, et al. Biochem Soc Trans. 2014 Aug;42(4):1180-3. doi: 10.1042/BST20140050. Biochem Soc Trans. 2014. PMID: 25110022 Review. - Alternative Splicing Regulatory Networks: Functions, Mechanisms, and Evolution.
Ule J, Blencowe BJ. Ule J, et al. Mol Cell. 2019 Oct 17;76(2):329-345. doi: 10.1016/j.molcel.2019.09.017. Mol Cell. 2019. PMID: 31626751 Review.
Cited by
- Dynamics of alternative splicing during somatic cell reprogramming reveals functions for RNA-binding proteins CPSF3, hnRNP UL1, and TIA1.
Vivori C, Papasaikas P, Stadhouders R, Di Stefano B, Rubio AR, Balaguer CB, Generoso S, Mallol A, Sardina JL, Payer B, Graf T, Valcárcel J. Vivori C, et al. Genome Biol. 2021 Jun 3;22(1):171. doi: 10.1186/s13059-021-02372-5. Genome Biol. 2021. PMID: 34082786 Free PMC article. - Computational assessment of the cooperativity between RNA binding proteins and MicroRNAs in Transcript Decay.
Jiang P, Singh M, Coller HA. Jiang P, et al. PLoS Comput Biol. 2013;9(5):e1003075. doi: 10.1371/journal.pcbi.1003075. Epub 2013 May 30. PLoS Comput Biol. 2013. PMID: 23737738 Free PMC article. - Rbfox3-regulated alternative splicing of Numb promotes neuronal differentiation during development.
Kim KK, Nam J, Mukouyama YS, Kawamoto S. Kim KK, et al. J Cell Biol. 2013 Feb 18;200(4):443-58. doi: 10.1083/jcb.201206146. J Cell Biol. 2013. PMID: 23420872 Free PMC article. - YB-1 binds to CAUC motifs and stimulates exon inclusion by enhancing the recruitment of U2AF to weak polypyrimidine tracts.
Wei WJ, Mu SR, Heiner M, Fu X, Cao LJ, Gong XF, Bindereif A, Hui J. Wei WJ, et al. Nucleic Acids Res. 2012 Sep 1;40(17):8622-36. doi: 10.1093/nar/gks579. Epub 2012 Jun 22. Nucleic Acids Res. 2012. PMID: 22730292 Free PMC article. - Developmental regulation of RNA processing by Rbfox proteins.
Conboy JG. Conboy JG. Wiley Interdiscip Rev RNA. 2017 Mar;8(2):10.1002/wrna.1398. doi: 10.1002/wrna.1398. Epub 2016 Oct 17. Wiley Interdiscip Rev RNA. 2017. PMID: 27748060 Free PMC article. Review.
References
- Black DL. Mechanisms of alternative pre-messenger RNA splicing. Annu Rev Biochem. 2003;72:291–336. - PubMed
- Thomson JA, et al. Embryonic stem cell lines derived from human blastocysts. Science. 1998;282:1145–1147. - PubMed
- Keller G. Embryonic stem cell differentiation: emergence of a new era in biology and medicine. Genes Dev. 2005;19:1129–1155. - PubMed
- Sonntag KC, Simantov R, Isacson O. Stem cells may reshape the prospect of Parkinson’s disease therapy. Brain Res Mol Brain Res. 2005;134:34–51. - PubMed
Publication types
MeSH terms
Substances
Grants and funding
- HG004659/HG/NHGRI NIH HHS/United States
- GM049369/GM/NIGMS NIH HHS/United States
- R01 GM049369/GM/NIGMS NIH HHS/United States
- R01 HG004659/HG/NHGRI NIH HHS/United States
- S10 RR025547/RR/NCRR NIH HHS/United States
LinkOut - more resources
Full Text Sources
Other Literature Sources


