A human B cell methylome at 100-base pair resolution - PubMed (original) (raw)
A human B cell methylome at 100-base pair resolution
Tibor A Rauch et al. Proc Natl Acad Sci U S A. 2009.
Abstract
Using a methylated-DNA enrichment technique (methylated CpG island recovery assay, MIRA) in combination with whole-genome tiling arrays, we have characterized by MIRA-chip the entire B cell "methylome" of an individual human at 100-bp resolution. We find that at the chromosome level high CpG methylation density is correlated with subtelomeric regions and Giemsa-light bands (R bands). The majority of the most highly methylated regions that could be identified on the tiling arrays were associated with genes. Approximately 10% of all promoters in B cells were found to be methylated, and this methylation correlates with low gene expression. Notably, apparent exceptions to this correlation were the result of transcription from previously unidentified, unmethylated transcription start sites, suggesting that methylation may control alternate promoter usage. Methylation of intragenic (gene body) sequences was found to correlate with increased, not decreased, transcription, and a methylated region near the 3' end was found in approximately 12% of all genes. The majority of broad regions (10-44 kb) of high methylation were at segmental duplications. Our data provide a valuable resource for the analysis of CpG methylation patterns in a differentiated human cell type and provide new clues regarding the function of mammalian DNA methylation.
Conflict of interest statement
The authors declare no conflict of interest.
Figures
Fig. 1.
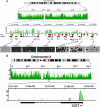
Snapshots of MIRA data from whole-genome methylation analysis. (A) The HOXA gene cluster on chromosome 7 was analyzed in detail. The methylation signal is shown plotted along the chromosome as a −log10 P value score (green). Therefore, the minimum number on the y axis is 0 (when P = 1). The P value score was obtained by NimbleScan software and is derived from the Kolmogorov-Smirnov test comparing the log2 ratios (MIRA vs. input) within a 750-bp window centered at each probe and the rest of the data on the array. The HOXA genes and the direction of transcription are indicated. The red boxes show the CpG islands. Methylation patterns at several CpG islands were confirmed by bisulfite sequencing. Open circles represent unmethylated CpG dinucleotides, and black circles represent methylated CpGs. The MIRA signals correlate with the density of methylated CpGs. (B) Analysis of the XIST locus on the active X chromosome. The promoter of the XIST gene shows a strong MRI.
Fig. 2.
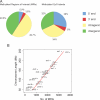
Distribution of DNA methylation along the B cell genome. (A) Distribution of MRIs and methylated CpG islands relative to annotated genes. A total of 42,944 MRIs were identified, and their location with respect to genes and the 5′ and 3′ ends of genes, defined as ±500 bp relative to the transcript start or end, was determined. Intragenic MRIs are located from +500 of transcription start to −500 of transcript end. Methylated CpG islands were defined as those CpG islands that overlap with an MRI. (B) Distribution of MRIs along individual chromosomes. The number of MRIs was plotted against the length of the chromosomes.
Fig. 3.
Methylation patterns along human chromosomes. (A) Chromosomal methylation density map (see text for details). Chromosome 7 is shown as an example. All other chromosomes are displayed in
Figs. S4-S7
. (B) Chromosomal methylation density profile of chromosome 7 (Middle) aligned with gene density profile (Top) and density of SINE elements (Bottom). (C) Correlation of methylation density and Giemsa staining. Giemsa staining intensity (from UCSC database) was partitioned into 5 groups (Giemsa negative and 4 groups, increasing from the 25th to the 100th percentile). Giemsa light bands have higher levels of DNA methylation. (D) Correlation of DNA methylation density with SINE and gene density. Density maps were determined using a 5-Mb sliding window with 500-kb step size along each chromosome. The Spearman correlation between DNA methylation density and gene density or SINE density was calculated, and the distribution of the correlations is plotted.
Fig. 4.
Expression of methylated genes is often explained by alternative promoter usage. In this example, data for the PARP12 gene are shown. The methylation profile is in green, and the red box indicates a CpG island. Initial analysis showed that this gene contains a methylated region in the promoter, but the gene is expressed according to expression microarrays. Using 5′ RACE, we identified an alternative transcript that emanates from an unmethylated promoter. RT-PCR analysis of the 2 alternative transcripts is shown in the bottom gel panel. mRNA1 is initiated from promoter 1, whereas mRNA2 is initiated from promoter 2.
Fig. 5.
Intragenic methylation and methylation at the 3′ end of genes. (A) Correlation between intragenic CpG methylation and gene expression levels. Data for gene expression levels in B cells were obtained from the GNF and GEO databases and were partitioned into 10 groups according to expression level (see Materials and Methods). The y axis is the percentage of methylated genes within each group defined as having at least 1 MRI within the gene body. With increased gene expression levels, there is a tendency toward increased intragenic methylation. Only the most highly expressed genes differ from the trend. (B) Identification of an MRI at the 3′ end of genes. The composite profile of methylation densities along all human RefSeq genes shows MRIs at the 5′ end of genes and near the 3′ end. The y axis is the average log2 ratio of all of the genes at each corresponding genome coordinate window. TSS, transcription start site; TES, transcript end site. (C) Methylation at 3′ gene ends and flanking genes. Genes present in tail-to-head orientation in the configuration indicated were analyzed in more detail. Genes in tail-to-head orientation were 1.5-fold more likely to have 3′-end MRIs than singular genes (P < 0.00001).
Similar articles
- DNA methylation profiling using the methylated-CpG island recovery assay (MIRA).
Rauch TA, Pfeifer GP. Rauch TA, et al. Methods. 2010 Nov;52(3):213-7. doi: 10.1016/j.ymeth.2010.03.004. Epub 2010 Mar 19. Methods. 2010. PMID: 20304072 Free PMC article. Review. - Genome-wide profiling of DNA methylation reveals a class of normally methylated CpG island promoters.
Shen L, Kondo Y, Guo Y, Zhang J, Zhang L, Ahmed S, Shu J, Chen X, Waterland RA, Issa JP. Shen L, et al. PLoS Genet. 2007 Oct;3(10):2023-36. doi: 10.1371/journal.pgen.0030181. Epub 2007 Sep 10. PLoS Genet. 2007. PMID: 17967063 Free PMC article. - DNA methylation analysis of chromosome 21 gene promoters at single base pair and single allele resolution.
Zhang Y, Rohde C, Tierling S, Jurkowski TP, Bock C, Santacruz D, Ragozin S, Reinhardt R, Groth M, Walter J, Jeltsch A. Zhang Y, et al. PLoS Genet. 2009 Mar;5(3):e1000438. doi: 10.1371/journal.pgen.1000438. Epub 2009 Mar 27. PLoS Genet. 2009. PMID: 19325872 Free PMC article. - Cell type-specific DNA methylation at intragenic CpG islands in the immune system.
Deaton AM, Webb S, Kerr AR, Illingworth RS, Guy J, Andrews R, Bird A. Deaton AM, et al. Genome Res. 2011 Jul;21(7):1074-86. doi: 10.1101/gr.118703.110. Epub 2011 May 31. Genome Res. 2011. PMID: 21628449 Free PMC article. - DNA methylation patterns in lung carcinomas.
Pfeifer GP, Rauch TA. Pfeifer GP, et al. Semin Cancer Biol. 2009 Jun;19(3):181-7. doi: 10.1016/j.semcancer.2009.02.008. Epub 2009 Feb 20. Semin Cancer Biol. 2009. PMID: 19429482 Free PMC article. Review.
Cited by
- Intragenic DNA methylation: implications of this epigenetic mechanism for cancer research.
Shenker N, Flanagan JM. Shenker N, et al. Br J Cancer. 2012 Jan 17;106(2):248-53. doi: 10.1038/bjc.2011.550. Epub 2011 Dec 13. Br J Cancer. 2012. PMID: 22166804 Free PMC article. Review. - DNA methylation: a timeline of methods and applications.
Harrison A, Parle-McDermott A. Harrison A, et al. Front Genet. 2011 Oct 25;2:74. doi: 10.3389/fgene.2011.00074. eCollection 2011. Front Genet. 2011. PMID: 22303369 Free PMC article. - Triphenyl Phosphate Alters Methyltransferase Expression and Induces Genome-Wide Aberrant DNA Methylation in Zebrafish Larvae.
Negi CK, Bláhová L, Phan A, Bajard L, Blaha L. Negi CK, et al. Chem Res Toxicol. 2024 Sep 16;37(9):1549-1561. doi: 10.1021/acs.chemrestox.4c00223. Epub 2024 Aug 29. Chem Res Toxicol. 2024. PMID: 39205618 Free PMC article. - DNA methylation and differentiation: HOX genes in muscle cells.
Tsumagari K, Baribault C, Terragni J, Chandra S, Renshaw C, Sun Z, Song L, Crawford GE, Pradhan S, Lacey M, Ehrlich M. Tsumagari K, et al. Epigenetics Chromatin. 2013 Aug 2;6(1):25. doi: 10.1186/1756-8935-6-25. Epigenetics Chromatin. 2013. PMID: 23916067 Free PMC article. - DNA methylation profiling using the methylated-CpG island recovery assay (MIRA).
Rauch TA, Pfeifer GP. Rauch TA, et al. Methods. 2010 Nov;52(3):213-7. doi: 10.1016/j.ymeth.2010.03.004. Epub 2010 Mar 19. Methods. 2010. PMID: 20304072 Free PMC article. Review.
References
- Bird AP. CpG-rich islands and the function of DNA methylation. Nature. 1986;321:209–213. - PubMed
- Suzuki MM, Bird A. DNA methylation landscapes: Provocative insights from epigenomics. Nat Rev Genet. 2008;9:465–476. - PubMed
- Jones PA. The DNA methylation paradox. Trends Genet. 1999;15:34–37. - PubMed
- Miranda TB, Jones PA. DNA methylation: the nuts and bolts of repression. J Cell Physiol. 2007;213:384–390. - PubMed
- Yoder JA, Walsh CP, Bestor TH. Cytosine methylation and the ecology of intragenomic parasites. Trends Genet. 1997;13:335–340. - PubMed
Publication types
MeSH terms
Substances
LinkOut - more resources
Full Text Sources
Molecular Biology Databases


