TORC2 plasma membrane localization is essential for cell viability and restricted to a distinct domain - PubMed (original) (raw)
TORC2 plasma membrane localization is essential for cell viability and restricted to a distinct domain
Doris Berchtold et al. Mol Biol Cell. 2009 Mar.
Abstract
The conserved target of rapamycin (TOR) kinases regulate many aspects of cellular physiology. They exist in two distinct complexes, termed TOR complex 1 (TORC1) and TOR complex 2 (TORC2), that posses both overlapping and distinct components. TORC1 and TORC2 respond differently to the drug rapamycin and have different cellular functions: whereas the rapamycin-sensitive TORC1 controls many aspects of cell growth and has been characterized in great detail, the TOR complex 2 is less understood and regulates actin polymerization, cell polarity, and ceramide metabolism. How signaling specificity and discrimination between different input signals for the two kinase complexes is achieved is not understood. Here, we show that TORC1 and TORC2 have different localizations in Saccharomyces cerevisiae. TORC1 is localized exclusively to the vacuolar membrane, whereas TORC2 is localized dynamically in a previously unrecognized plasma membrane domain, which we term membrane compartment containing TORC2 (MCT). We find that plasma membrane localization of TORC2 is essential for viability and mediated by lipid binding of the C-terminal domain of the Avo1 subunit. From these data, we suggest that the TOR complexes are spatially separated to determine downstream signaling specificity and their responsiveness to different inputs.
Figures
Figure 1.
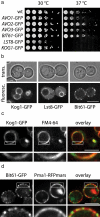
Functional GFP-tagged TORC1 and TORC2 subunits localize to the vacuolar and the plasma membrane, respectively. (a) GFP-tagged TORC2 subunits Avo1, Avo2, Avo3, and Bit61 support normal yeast growth, whereas LST8-GFP and KOG1-GFP are temperature-sensitive alleles. The indicated subunits of TOR complexes were tagged with GFP in their endogenous locus (see Materials and Methods). The resulting strains were grown in Log-phase, serially diluted, spotted on YPD medium and grown at 30°C (left) and under heat shock conditions at 37°C (right). (b) Kog1-GFP, Lst8-GFP, and Bit61-GFP localize to distinct places. Cells expressing the indicated GFP fusions were analyzed by confocal microscopy. Representative fluorescent images (bottom) and transmitted light images (top) are shown. Bar, 5 μm. (c) Kog1-GFP localizes to the vacuolar membrane. Kog1-GFP (left) localization was analyzed by fluorescence microscopy in cells with FM4-64 marked vacuoles (middle). The right panel shows an overlay of the channels. Representative confocal midsections are shown. Insets indicate higher magnification of the indicated part of the image. Bar, 5 μm. (d) Bit61-GFP localizes to the plasma membrane. Bit61-GFP (left) localization was analyzed by fluorescence microscopy in cells expressing Pma1-RFPmars (middle). The right panel shows an overlay of the channels. Representative confocal midsections are shown. Insets indicate higher magnification of the indicated part of the image. Bar, 5 μm.
Figure 2.
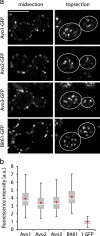
All subunits of TORC2 localize to the plasma membrane in a similar pattern. (a) All exclusive TORC2 subunits show a similar pattern at the plasma membrane. Strains carrying the indicated subunits of TORC2 as the only allele of the corresponding gene were analyzed by confocal microscopy. Representative midsections (left) and top sections (right) are shown. White lines delineate the perimeter of the cell. Bar, 5 μm. (b) Each TORC2 focus contains two to six copies of each subunit. GFP signals measured from unprocessed cell surface images were quantitated and related to a GFP standard. The median of the signal from >100 measurements is shown as a red diamond, the mean is shown as a white line in a gray box, outlines of the box indicate the 0.25 and the 0.75 quartiles. Error bars are 1.5 interquartile ranges from the mean. For details, see Supplemental Figure 1 and Materials and Methods.
Figure 3.
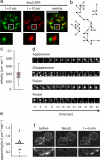
TORC2 localization at the plasma membrane is highly dynamic. (a) The TORC2 pattern at the plasma membrane changes rapidly. Surface images of cells expressing Avo3-GFP were collected in 400-ms intervals. The image t = 0 s is shown in green (left); the image t = 10 s is shown in red (middle). Overlay of the images shows that the pattern is highly dynamic. Bar, 2.5 μm. (b) TORC2 foci move in the plane of the membrane. Tracks of three different TORC2 foci from the first frame to their disappearance are shown. Markers indicate the position of the foci at 3-s intervals. (c) TORC2 foci move with an average speed of 0.039 μm s−1. Tracks (141) such as shown in b were used to calculate the average speed of foci. (d) TORC2 foci undergo fusion, fission, and they appear and disappear. Analogously to a, movies with 3-s intervals were collected. Panels show representative time-lapse sequences of appearance, disappearance, fusion, and fission of foci. (e) On average, 0.61 TORC2 foci occur per minute on a square micrometer of cell surface. Appearances were counted in image sequences such as used for b and related to the cell surface and time. (f) TORC2 foci form in photo bleached regions of the cell. To confirm the appearance of TORC2 foci independently, we bleached one-half of a cell and followed TORC2 foci over time. A representative image before the bleach (left), right after the bleach (middle), and after 6 min (right) is shown. Bottom panels show higher magnification of the bleached area. Bar, 5 μm.
Figure 4.
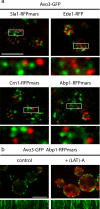
TORC2 foci are different from actin patches. (a) TORC2 foci do not colocalize with actin patches. Avo3-GFP (green) was expressed in cells expressing either Sla1, Ede1, Crn1, or Abp1 tagged with the RFPmars fluorophore (red). Representative surface images are shown; insets show parts of the cell surface in higher magnification. Bar, 5 μm. (b) TORC2 lateral mobility is not dependent on actin. Cells expressing Abp1-RFPmars (red) and Avo3-GFP (green) were treated with latrunculin A [+(LAT)-A] for 10 min (right). This lead to complete disassembly of Abp1 patches. Kymographs of representative movies show Avo3-GFP signal along the perimeter of control and LAT-A treated cells for a period of 50 s (bottom).
Figure 5.
TORC2 foci localize to distinct plasma membrane domains. (a) TORC2 foci localize to a plasma membrane domain distinct from MCC/eisosomes. The indicated subunits of TORC2 were expressed as GFP fusion proteins (green) in cells also expressing a RFPmars-tagged eisosome component (red). Insets show a higher magnification of the area indicated. Bar, 5 μm. (b) Line scan of the indicated region of a Bit61-GFP/Lsp1-RFPmars image obtained as in a. (c) TORC2 foci localize to a plasma membrane compartment different from MCP. Bit61-GFP (green) was expressed in cells also harboring the MCP marker Pma1-RFPmars (red). Representative surface images are shown. Insets show a higher magnification of the area indicated. Bar, 2.5 μm. (d) Line scan of the indicated region of a Bit61-GFP/Pma1-RFPmars image analogous to c.
Figure 6.
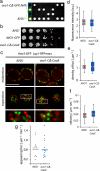
Plasma membrane localization of TORC2 is essential. (a) The C-terminal domain of Avo1 is essential. The C-terminal 117 amino acids of Avo1 were deleted in a diploid strain; the resulting heterozygote sporulated and the progeny were dissected. A representative dissection is shown. Marker analysis revealed that progeny with the C-terminal part of Avo1 deleted are not viable. (b) A heterologous CaaX-box lipidation signal can rescue the deletion of the Avo1 C terminus. The C-terminal 117 amino acids of Avo1 were replaced by a CaaX box in a diploid strain. The resulting cells were sporulated and dissected. The progeny showed no growth phenotype on either a spotting plate (b) or in liquid culture as analyzed by optical density measurements at 600 nm over time. (c) The CaaX box replacing the C terminus of Avo1 is sufficient to mediate normal plasma membrane targeting of TORC2. avo1-CΔ-CaaX was expressed in cells harboring a fluorescently tagged Avo3 (green) and Lsp1-RFPmars (red). Cells were imaged by fluorescence microscopy and representative midsections (top), top sections (middle), and higher magnification inserts (bottom) are shown. Bar, 5 μm. (d) TORC2 foci have normal size in avo1-C_Δ_-CaaX cells. Foci from images as shown in c were analyzed as in Figure 2b. (e) TORC2 foci have the same density in wild-type and avo1-C_Δ_-CaaX cells. Surface images were used to calculate the number of foci per square micrometer. (f) TORC2 foci have the same velocity in wild-type and avo1-C_Δ_-CaaX cells. Velocities in the plane of the membrane were calculated as in Figure 3c. (g) TORC2 foci have the same rate of appearance in wild-type and avo1-C_Δ_-CaaX cells. Rates were calculated as in Figure 3e.
Figure 7.
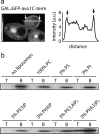
The C-terminal domain of Avo1 binds to plasma membrane PI(4,5)P2. (a) The C-terminal domain of Avo1 is sufficient to mediate plasma membrane targeting. The C-terminal 117 amino acids of Avo1 were fused to GFP and expressed from the Gal promoter. A representative midsection is shown (left). The right panel shows a line profile through the midsection of the cell, as indicated in the left panel. Bar, 5 μm. (b) The C-terminal domain of Avo1 binds to PI(4,5)P2. Amino acids 1054–1176 of Avo1 were fused to a 6xHis-Tag, expressed in E. coli, and purified by affinity chromatography. The pure protein was incubated 1 h with liposomes containing only PC, PC with 3% PS, PC with 3% PI, PC with 3% PI(3)P, PC with 3% PI(4)P, PC with 3% PI(3,4)P2, or PC with 3% PI(4,5)P2. Subsequently, the samples were loaded onto a sucrose gradient, spun, and the floating fraction (T) was analyzed in comparison with the fraction remaining at the bottom of the gradient (B) by SDS-PAGE.
Similar articles
- Analysis of the roles of phosphatidylinositol-4,5-_bis_phosphate and individual subunits in assembly, localization, and function of Saccharomyces cerevisiae target of rapamycin complex 2.
Martinez Marshall MN, Emmerstorfer-Augustin A, Leskoske KL, Zhang LH, Li B, Thorner J. Martinez Marshall MN, et al. Mol Biol Cell. 2019 Jun 1;30(12):1555-1574. doi: 10.1091/mbc.E18-10-0682. Epub 2019 Apr 10. Mol Biol Cell. 2019. PMID: 30969890 Free PMC article. - Molecular organization of target of rapamycin complex 2.
Wullschleger S, Loewith R, Oppliger W, Hall MN. Wullschleger S, et al. J Biol Chem. 2005 Sep 2;280(35):30697-704. doi: 10.1074/jbc.M505553200. Epub 2005 Jul 7. J Biol Chem. 2005. PMID: 16002396 - The TORC2-Dependent Signaling Network in the Yeast Saccharomyces cerevisiae.
Roelants FM, Leskoske KL, Martinez Marshall MN, Locke MN, Thorner J. Roelants FM, et al. Biomolecules. 2017 Sep 5;7(3):66. doi: 10.3390/biom7030066. Biomolecules. 2017. PMID: 28872598 Free PMC article. Review. - Eisosomes at the intersection of TORC1 and TORC2 regulation.
Babst M. Babst M. Traffic. 2019 Aug;20(8):543-551. doi: 10.1111/tra.12651. Epub 2019 May 30. Traffic. 2019. PMID: 31038844 Free PMC article. Review.
Cited by
- Plasma membrane stress induces relocalization of Slm proteins and activation of TORC2 to promote sphingolipid synthesis.
Berchtold D, Piccolis M, Chiaruttini N, Riezman I, Riezman H, Roux A, Walther TC, Loewith R. Berchtold D, et al. Nat Cell Biol. 2012 Apr 15;14(5):542-7. doi: 10.1038/ncb2480. Nat Cell Biol. 2012. PMID: 22504275 - Patchwork organization of the yeast plasma membrane into numerous coexisting domains.
Spira F, Mueller NS, Beck G, von Olshausen P, Beig J, Wedlich-Söldner R. Spira F, et al. Nat Cell Biol. 2012 Apr 29;14(6):640-8. doi: 10.1038/ncb2487. Nat Cell Biol. 2012. PMID: 22544065 - The Gpr1-regulated Sur7 family protein Sfp2 is required for hyphal growth and cell wall stability in the mycoparasite Trichoderma atroviride.
Atanasova L, Gruber S, Lichius A, Radebner T, Abendstein L, Münsterkötter M, Stralis-Pavese N, Łabaj PP, Kreil DP, Zeilinger S. Atanasova L, et al. Sci Rep. 2018 Aug 13;8(1):12064. doi: 10.1038/s41598-018-30500-y. Sci Rep. 2018. PMID: 30104659 Free PMC article. - Role of MCC/Eisosome in Fungal Lipid Homeostasis.
Zahumensky J, Malinsky J. Zahumensky J, et al. Biomolecules. 2019 Jul 25;9(8):305. doi: 10.3390/biom9080305. Biomolecules. 2019. PMID: 31349700 Free PMC article. Review. - Sur7 promotes plasma membrane organization and is needed for resistance to stressful conditions and to the invasive growth and virulence of Candida albicans.
Douglas LM, Wang HX, Keppler-Ross S, Dean N, Konopka JB. Douglas LM, et al. mBio. 2011 Dec 27;3(1):e00254-11. doi: 10.1128/mBio.00254-11. Print 2012. mBio. 2011. PMID: 22202230 Free PMC article.
References
- Araki T., Uesono Y., Oguchi T., Toh E. A. LAS24/KOG1, a component of the TOR complex 1 (TORC1), is needed for resistance to local anesthetic tetracaine and normal distribution of actin cytoskeleton in yeast. Genes Genet. Syst. 2005;80:325–343. - PubMed
Publication types
MeSH terms
Substances
LinkOut - more resources
Full Text Sources
Molecular Biology Databases
