The adenomatous polyposis coli protein is an essential regulator of radial glial polarity and construction of the cerebral cortex - PubMed (original) (raw)
The adenomatous polyposis coli protein is an essential regulator of radial glial polarity and construction of the cerebral cortex
Yukako Yokota et al. Neuron. 2009.
Abstract
Radial glia are highly polarized cells that serve as neuronal progenitors and as scaffolds for neuronal migration during construction of the cerebral cortex. How radial glial cells establish and maintain their morphological polarity is unknown. Using conditional gene targeting in mice, we demonstrate that adenomatous polyposis coli (APC) serves an essential function in the maintenance of polarized radial glial scaffold during brain development. In the absence of APC, radial glial cells lose their polarity and responsiveness to the extracellular polarity maintenance cues, such as neuregulin-1. Elimination of APC further leads to marked instability of the radial glial microtubule cytoskeleton. The resultant changes in radial glial function and loss of APC in radial glial progeny lead to defective generation and migration of cortical neurons, severely disrupted cortical layer formation, and aberrant axonal tract development. Thus, APC is an essential regulator of radial glial polarity and is critical for the construction of cerebral cortex in mammals.
Figures
Figure 1. Disrupted corticogenesis in conditional mutants of APC
(A–H) Nestin-Cre mediated recombination was used to inactivate APC expression in the developing brain. (A) Immunoblot analysis of whole cell extracts of E16 cerebral cortex indicates significant reduction in APC following Nestin-Cre mediated recombination of APC floxed alleles. Nissl labeled cortical sections from embryonic day (E) 13 [B, C, F, G] and 17 [D, E, H, I] indicate widespread cellular disorganization of cortical structures throughout the rostro-caudal extent of developing brain in mice deficient in APC (_APC_lox/loxNestin-Cre; F–I). R-rostral, C- caudal. Scale bar: 230 μm (B, C, F, G), 1100μm (D, E, H, I).
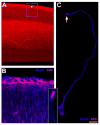
Figure 2. APC expression in developing cerebral cortex
(A) Immunohistochemical localization of APC at E16 indicates prominent APC expression throughout the developing cerebral wall. Enriched level of expression is evident in the subpial region (asterisk). Panel B is a higher magnification image of an area outlined region in panel A. Here, co-localization with radial glial specific anti- BLBP antibodies demonstrates preferential localization of APC in radial glial endfeet (B). Inset (B) shows an isolated radial glial endfeet in vivo with enriched APC localization. In vitro, APC is expressed in a polarized manner (highly at the tips of the elongated process[arrow] and in the soma) in radial glia labeled with antibodies to radial glial specific marker, BLBP (C). Scale bar: A, 42 μm; B, 27μm; C, 20 μm.
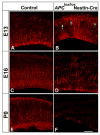
Figure 3. Loss of radial glia polarity following APC deletion
Radial glia in E13, 16, and P0 cortices were labeled with radial glial specific RC2 antibodies. In control cortex, polarized radial glia span the width of the cerebral wall (A, C, E). In contrast, in APC deficient cortex, this characteristic polarized organization of radial glia is drastically disrupted (B, D, F). Radial glial cells are clearly generated in APC deficient mice as evident by their presence at E13(B). However, their elongated processes near the pial surface often points in directions away from the pial surface and are aberrantly branched (arrowheads, B). As cortex develops, they are unable to maintain their polarized morphology-by E16, APC deficient radial glial cells lack the elongated processes spanning the entire width of cortex, instead radial glial processes are shorter and misoriented away from the pial surface (C, D). By P0, vast majority of APC deficient radial glia do not have a radial process (E, F). Scale bar: A–B, 30 μm; C–D, 56μm; E–F, 145 μm.
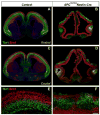
Figure 4. Disrupted Radial glial development in _APC_lox/loxhGFAP-Cre cerebral cortex
hGFAP- Cre mediated recombination was used to inactivate APC in radial glia. At E16, hGFAP promoter- Cre mediated recombination occurs widely throughout the dorsal, but not ventral, cortex. (A) Radial glial scaffolding (purple) is evident throughout the normal developing cerebral cortex. In contrast, radial glia development is completely disrupted, specifically in the dorsal regions of cortex in _APC_lox/loxhGFAP-Cre mice (B). Dorsal and ventral regions of cortex are indicated by asterisk and arrow, respectively (A, B). Dotted lines in panel B indicates the border between dorsal and ventral cortex. (C, D) Higher magnification images of dorsal cortex from control (C) and _APC_lox/loxhGFAP-Cre (D) mice illustrates the lack of radial glial scaffolding in dorsal cortex of APC deficient mice. In contrast, in the ganglionic eminence region of the ventral cortex, radial glial scaffolding appears similar in control (E) and _APC_lox/loxhGFAP-Cre mice (F). Arrowheads in panels E and F points to polarized radial processes. Labeling with anti- Tbr1 antibodies (green) indicate normal placement of deeper layer neurons in control (A, C), but not in APC deficient cortex (B, D). Scale bar: A–B, 165 μm; C–D, 60μm; E-F, 90μm.
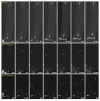
Figure 5. APC is critical for polarized extension of radial glia
Radial glia in E16 control and APC deficient cortices were electroporated with BLBP-GFP DNA. GFP+ radial glia in control and APC deficient mice were then repeatedly imaged at 5–10 minute intervals for several hours. (A) Control radial glia are polarized and extend their basal process (arrow) towards pial surface. In contrast, APC deficient radial glia appear unable to radially orient and extend towards the pial surface (B, C). Instead, they extend or branch randomly throughout the developing cerebral wall (arrowhead, B, C). Time elapsed between observations are indicated in hours. These images were compiled as AVI movie files to illustrate the differences in radial polarity between control (Supplemental movie 1) and APC deficient (Supplemental movies 2, 3, and 4) radial glia. Time length = 16.5 hrs.(Supplemental movie 1), 19.5 hrs. (Supplemental movie 2), 10.8 hrs. (Supplemental movie 3), 10.8 hrs. (Supplemental movie 4). Scale bar: 22 μm.
Figure 6. Reduced proliferation of radial glial progenitors in APC deficient cerebral cortex
(A–C) Proliferating radial progenitors in embryonic cortex were labeled with anti- phospho histone antibodies. APC deficiency leads to significant reduction in progenitor proliferation. (D–F) Similar reduction in cortical precursor proliferation was also noticed with BrdU pulse labeling. E14 and 16 mice were given BrdU pulse injections for an hour and BrdU labeled cells were quantified in control and APC deficient cortex (F). Analysis of BrdU and Ki67 double-labeled cells indicates that the fraction of actively cycling BrdU+/Ki67+ cells was reduced significantly in APC deficient cortex (far right panel, F). (G) Labeling of proliferating radial progenitors in the ventricular zone with anti-α tubulin antibodies and nuclear DNA marker, bis benzimide, indicates the normal formation mitotic spindles (arrows) in control radial progenitors at different stages of cell cycle. In contrast, APC deficient progenitors lack properly organized mitotic spindles (arrowheads). They are often unaligned and unattached. (H–J). Reduction in precursor proliferation is paralleled by enhanced apoptosis in APC deficient cortex. Apoptotic cells were labeled with anti- caspase 3 antibodies. Panels shown in A–B, D–G, and H–I are from E14, 16, and P0, respectively. Sections were Nissl counterstained [blue]. Data shown are mean ±SEM (n=3); asterisk, significant when compared with controls at p<0.01 (Student’s t test). M-M phase, A/T-anaphase/telophase. Scale bar: A–B, 20 μm; D–E, 60μm; G, 6μm; H–I, 114μm.
Figure 7. APC deletion disrupts laminar organization of neurons in cerebral cortex
Upper and deeper layer neurons in E16.5 cortices from control and APClox/loxNestin-Cre mice were labeled with anti- Brn-1 and Tbr1 antibodies, respectively. Characteristic laminar organization was evident throughout the rostro-caudal extent in control cortices (A, C), but was totally disrupted in APC deficient cortex (B, D). APC deficient neurons are distributed as ectopias throughout the cortex. (E, F) Higher magnification images of control (E) and APClox/loxNestin-Cre cortical plate (F) illustrate the ectopic positioning of neurons destined to distinct layers in APC mutant mice. Scale bar: 900 μm (A–D), 110μm (E–F).
Figure 8. APC regulates patterns of neuronal connectivity in the developing cerebral cortex
(A–B) Labeling of axons entering and exiting the developing cerebral wall (E16) with anti-L1 antibodies indicates that the characteristic patterns of growth of these axonal fiber tracts are disrupted in APC deficient mice. (C, D) At E14 when newly arrived neurons in the cortical plate begin to extend axons (asterisk, C), APC deficiency leads to disrupted axonal extension characterized by clustered swirling of these axons (arrow, D). By E16, the patterned growth of major cortical fiber tracts is altered in APC deficient cortex. Higher magnification images of midbrain regions (E, F) and cortico- striatal boundary (G, H) demonstrate the deficits in the extension and orientation of axons traversing in posterior commisure ([PC]; E, F), habenulo- peduncular tracts ([HPT]; E, F) and internal capsule ([IC]; G, H). Compare the areas indicated by asterisk and arrow (E–H). Labeling of thalamocortical axons with anti- calretinin antibodies (Bloom et al., 2007) indicates the drastic disruption of their extension into the cortex (I, J). Instead of fasciculating adjacent to L1+axonal tracts (arrowheads, I), they extend in a totally disorganized manner within the cerebral wall (arrowheads, J). In vitro, APC deficient neurons can extend axons, but they are exuberantly branched with increased number of primary and secondary branches (K–M). Compared to controls, the growth tips of these axons consistently curl around (arrowheads, L; N). IC- internal capsule, PC- posterior commisure, HPT- habenulo- peduncular tract. Data shown are mean ± SEM; asterisk indicates significance compared with controls at p<0.01 (Student’s t-test). Scale bar: 325 μm (A–B), 275μm (C–D), 250μm (E–H), 180μm (K–L).
Figure 9. APC deletion dramatically up regulates β-catenin expression in the developing cerebral cortex
(A) Immunoblot analysis of E16 cerebral cortex indicates up regulation of total β-catenin and dephosphorylated (active) β-catenin in APC deficient cortex. (B–E) Immunohistochemical analysis indicates that, instead of the prominent apical expression of β-catenin noticed in the normal cerebral wall (arrows, B, C), significant up regulation of β-catenin is evident throughout the APC deficient cortex (arrowheads, D, E). Panels B and D show low magnification images of the entire cerebral wall, whereas panels C and E are higher magnification images of the ventricular zone region. (F–H) In dissociated cortical cells, prominent β-catenin localization is noticed at sites of cell- cell contacts (arrow, F). In contrast, APC deletion leads to loss of this characteristic pattern of expression at the sites of cell- cell contacts and upregulation of nuclear localized β-catenin (compare asterisks, F, G; H). (I–K) To determine if the up-regulated β-catenin is transcriptionally active, control and APC deficient cortices were electroporated with a β-catenin activity reporter construct, TOPdGFP. mCherry expression serves as control. APC deficiency leads to significant up regulation of active β-catenin as indicated by enhanced GFP expression. Quantification of β-catenin activation (K). Scale bar: 310 μm (B, D), 35μm (C, E), 12.5μm (F, G), 110μm (I), 100μm (J).
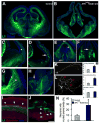
Figure 10. Altered microtubule dynamics in APC deficient cortex
(A–B) Microtubules of radial progenitors in the embryonic cerebral cortex (E15) were labeled with EMTB-3GFP. Labeled cells were imaged at 6-minute intervals and cell soma images from adjacent time intervals were superimposed (merge, A) to evaluate overall changes in microtubule cytoskeleton between different time points of observation. The more overlap of microtubule cytoskeleton between adjacent time points, the more stability of microtubules and less the overall dynamic changes in microtubule cytoskeleton. Compared to control (A), microtubules in APC deficient cells are less stable and rapidly rearranged, thus leading to less overlap (B). Line scans (red line, A–B) spanning the width of the cell soma were used to quantify the spots (yellow arrows, A–B [merge]) of microtubule cytoskeletal overlap between observations. APC deficiency leads to fewer overlaps and thus indicating reduced stability (C). The time-lapse images were also compiled as AVI movie files to illustrate the differences in microtubule dynamics between control (Supplemental movie 5) and APC deficient (Supplemental movie 6) radial progenitors. (D) Immunoblot analysis of acetylated tubulin in control and APC deficient cortex indicates that APC deletion reduced the level of stable, acetylated microtubules. (E–F) Following nocodazole treatment, extensive network of stable, acetylated microtubules is evident in control radial progenitors, whereas fewer stable microtubules were noticed in APC deficient cells. (G) Altered orientation of microtubule plus end growth in APC cKO. Patterns of movement of 14 randomly selected EB1-positive microtubule plus ends at the leading edges were traced to indicate the general trajectory and orientation of movement during a period of 60 seconds. Compared to controls (A), many EB1+ microtubule tips moved in directions away from cell cortex in APC deficient cells (see asterisks, B). Also see supplemental see movie files #7 (control) and 8 (APClox/loxNestin-Cre). (H–I) Evidence of microtubule instability is also noticed in APC deficient cortical neurons. Tubulin labeling indicates the presence of diffuse, unfacsiculated microtubule filaments at axonal branch points (arrowheads, I) in APC deficient neurons. In contrast, microtubule filaments in control neurons are tightly facsciculated at branch points (asterisk, H). Number of cells/group= 30 (C). Time elapsed between observations are indicated in minutes (A–B). Data shown are mean ± SEM; asterisk, significant when compared with controls at p<0.001 (Student’s t test). Also see movie files #5 (Control) and 6 (APClox/loxNestin-Cre). Time length = 8.3 hrs.(Supplemental movie 5), 6.5 hrs. (Supplemental movie 6), 110 seconds (Supplemental movies 7 and 8). Scale bar: 15 μm (A, B), 10μm (E, F), 2μm (G), 7μm (H, I).
Similar articles
- Cdc42 and Gsk3 modulate the dynamics of radial glial growth, inter-radial glial interactions and polarity in the developing cerebral cortex.
Yokota Y, Eom TY, Stanco A, Kim WY, Rao S, Snider WD, Anton ES. Yokota Y, et al. Development. 2010 Dec;137(23):4101-10. doi: 10.1242/dev.048637. Development. 2010. PMID: 21062867 Free PMC article. - MARCKS modulates radial progenitor placement, proliferation and organization in the developing cerebral cortex.
Weimer JM, Yokota Y, Stanco A, Stumpo DJ, Blackshear PJ, Anton ES. Weimer JM, et al. Development. 2009 Sep;136(17):2965-75. doi: 10.1242/dev.036616. Development. 2009. PMID: 19666823 Free PMC article. - Arl13b-regulated cilia activities are essential for polarized radial glial scaffold formation.
Higginbotham H, Guo J, Yokota Y, Umberger NL, Su CY, Li J, Verma N, Hirt J, Ghukasyan V, Caspary T, Anton ES. Higginbotham H, et al. Nat Neurosci. 2013 Aug;16(8):1000-7. doi: 10.1038/nn.3451. Epub 2013 Jun 30. Nat Neurosci. 2013. PMID: 23817546 Free PMC article. - Role of adenomatous polyposis coli (APC) and microtubules in directional cell migration and neuronal polarization.
Barth AI, Caro-Gonzalez HY, Nelson WJ. Barth AI, et al. Semin Cell Dev Biol. 2008 Jun;19(3):245-51. doi: 10.1016/j.semcdb.2008.02.003. Epub 2008 Feb 23. Semin Cell Dev Biol. 2008. PMID: 18387324 Free PMC article. Review. - Coordinating cerebral cortical construction and connectivity: Unifying influence of radial progenitors.
Casingal CR, Descant KD, Anton ES. Casingal CR, et al. Neuron. 2022 Apr 6;110(7):1100-1115. doi: 10.1016/j.neuron.2022.01.034. Epub 2022 Feb 24. Neuron. 2022. PMID: 35216663 Free PMC article. Review.
Cited by
- Arl13b in primary cilia regulates the migration and placement of interneurons in the developing cerebral cortex.
Higginbotham H, Eom TY, Mariani LE, Bachleda A, Hirt J, Gukassyan V, Cusack CL, Lai C, Caspary T, Anton ES. Higginbotham H, et al. Dev Cell. 2012 Nov 13;23(5):925-38. doi: 10.1016/j.devcel.2012.09.019. Dev Cell. 2012. PMID: 23153492 Free PMC article. - Integrative mechanisms of oriented neuronal migration in the developing brain.
Evsyukova I, Plestant C, Anton ES. Evsyukova I, et al. Annu Rev Cell Dev Biol. 2013;29:299-353. doi: 10.1146/annurev-cellbio-101512-122400. Epub 2013 Aug 7. Annu Rev Cell Dev Biol. 2013. PMID: 23937349 Free PMC article. Review. - Molecular components and polarity of radial glial cells during cerebral cortex development.
Chou FS, Li R, Wang PS. Chou FS, et al. Cell Mol Life Sci. 2018 Mar;75(6):1027-1041. doi: 10.1007/s00018-017-2680-0. Epub 2017 Oct 10. Cell Mol Life Sci. 2018. PMID: 29018869 Free PMC article. Review. - Wnt/β-catenin signaling pathway: proteins' roles in osteoporosis and cancer diseases and the regulatory effects of natural compounds on osteoporosis.
Wang X, Qu Z, Zhao S, Luo L, Yan L. Wang X, et al. Mol Med. 2024 Oct 28;30(1):193. doi: 10.1186/s10020-024-00957-x. Mol Med. 2024. PMID: 39468464 Free PMC article. Review. - The APC tumor suppressor is required for epithelial cell polarization and three-dimensional morphogenesis.
Lesko AC, Goss KH, Yang FF, Schwertner A, Hulur I, Onel K, Prosperi JR. Lesko AC, et al. Biochim Biophys Acta. 2015 Mar;1853(3):711-23. doi: 10.1016/j.bbamcr.2014.12.036. Epub 2015 Jan 8. Biochim Biophys Acta. 2015. PMID: 25578398 Free PMC article.
References
- Ahmed Y, Hayashi S, Levine A, Wieschaus E. Regulation of armadillo by a Drosophila APC inhibits neuronal apoptosis during retinal development. Cell. 1998;93:1171–1182. - PubMed
- Akong K, McCartney BM, Peifer M. Drosophila APC2 and APC1 have overlapping roles in the larval brain despite their distinct intracellular localizations. Dev Biol. 2002;250:71–90. - PubMed
- Anton ES, Ghashghaei HT, Weber JL, McCann C, Fischer TM, Cheung ID, Gassmann M, Messing A, Klein R, Schwab MH, et al. Receptor tyrosine kinase ErbB4 modulates neuroblast migration and placement in the adult forebrain. Nat Neurosci. 2004;7:1319–1328. - PubMed
- Anton ES, Marchionni MA, Lee KF, Rakic P. Role of GGF/neuregulin signaling in interactions between migrating neurons and radial glia in the developing cerebral cortex. Development. 1997;124:3501–3510. - PubMed
- Anthony TE, Klein C, Fishell G, Heintz N. Radial glia serve as neuronal progenitors in all regions of the central nervous system. Neuron. 2004;41:881–90. - PubMed
Publication types
MeSH terms
Substances
Grants and funding
- R01 NS050968/NS/NINDS NIH HHS/United States
- R01 MH060929-10/MH/NIMH NIH HHS/United States
- P30 NS045892/NS/NINDS NIH HHS/United States
- NS050968/NS/NINDS NIH HHS/United States
- R01 MH060929/MH/NIMH NIH HHS/United States
- R01 MH063660/MH/NIMH NIH HHS/United States
- NS045892/NS/NINDS NIH HHS/United States
- MH63660/MH/NIMH NIH HHS/United States
- R01 MH060929-11/MH/NIMH NIH HHS/United States
LinkOut - more resources
Full Text Sources
Other Literature Sources
Molecular Biology Databases

