Principal component analysis of native ensembles of biomolecular structures (PCA_NEST): insights into functional dynamics - PubMed (original) (raw)
Principal component analysis of native ensembles of biomolecular structures (PCA_NEST): insights into functional dynamics
Lee-Wei Yang et al. Bioinformatics. 2009.
Erratum in
- Bioinformatics. 2009 Aug 15;25(16):2147
Abstract
Motivation: To efficiently analyze the 'native ensemble of conformations' accessible to proteins near their folded state and to extract essential information from observed distributions of conformations, reliable mathematical methods and computational tools are needed.
Result: Examination of 24 pairs of structures determined by both NMR and X-ray reveals that the differences in the dynamics of the same protein resolved by the two techniques can be tracked to the most robust low frequency modes elucidated by principal component analysis (PCA) of NMR models. The active sites of enzymes are found to be highly constrained in these PCA modes. Furthermore, the residues predicted to be highly immobile are shown to be evolutionarily conserved, lending support to a PCA-based identification of potential functional sites. An online tool, PCA_NEST, is designed to derive the principal modes of conformational changes from structural ensembles resolved by experiments or generated by computations.
Availability: http://ignm.ccbb.pitt.edu/oPCA\_Online.htm
Figures
Fig. 1.
An ensemble of conformations and corresponding variations in residue positions. (a) An ensemble of NMR models (teal) for ubiquitin (1xqq; Lindorff-Larsen et al., 2005) and corresponding X-ray structure (1ubq; yellow), are optimally superimposed as described in Method (left). The mean structure of the NMR ensemble (gray) moves towards its X-ray counterpart (yellow) along the first PC mode, v(1), indicated by the blue arrows (right). (b) Per residue RMSD, <(Δ**q**_i_)2>1/2 [based on α-carbons; see Equation (2)] as a function of residue index i, derived from the NMR ensemble shown in (a). (c) Difference, Δ{Φ}i (blue, solid curve) in the position of residue i, between the average NMR and the X-ray structures and comparison with the first PC mode |vi(1)| (red, dotted curve).
Fig. 2.
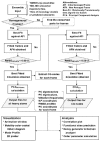
Flow diagram of PCA_NEST. The ensemble of native structures is subjected to PCA at two levels, atomic (left column) and CG (right column). See the text for more details.
Fig. 3.
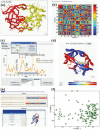
PCA_NEST outputs and interfaces, illustrated for HIV-1 protease (PDB code: 1bve). (a) Conformational changes along the first PC mode. The diagram represents a snapshot from a JMol animation describing the conformational fluctuations favored by this particular mode. The arrows refer to the elements of the first eigenvector v(1); they describe the directions of the movements of each CG-node, and their lengths are proportional to the magnitude of the fluctuations. Active sites Asp25 and Thr26 are shown in spheres. (b) Residue–residue correlation map for the first PC mode (see
Supplementary Material
for details) (c) **M**12,i profiles [see Equation (8)] for monomers A and B of HIV-1 protease. The minima in the profile are further analyzed (with regard to the solvent exposure and spatial clustering of the corresponding residues) to identify PFSs. (d) Ribbon diagram illustrating the PCA_NEST-defined dynamic domains. Different colors indicate substructures subject to opposite direction (anticorrelated) movements in the first PC mode. We note that active sites are located near the interface between the dynamic domains in the center of the molecule. (e) Decoys along the PC mode 1. Decoys are created in pairs (along the positive and negative directions of the first PC), and they are automatically submitted to DynDom (Hayward and Berendsen, 1998) for dynamic domain analysis. (f) Distribution of the 128 NMR frames deposited for ubiquitin (1xqq) on the conformational subspace spanned by PC modes 1 and 2. Such projection onto a reduced space allows for clustering structures based on their dominant conformational features.
Fig. 4.
Fluctuation profiles induced by dominant PC modes. Four examples are displayed, which illustrate how the enzyme active sites (green squares) lie at the minima of the normalized **M**12,i profiles (ordinate) based on PC modes 1 and 2, drawn a function of residue index (abscissa). The ribbon diagrams in the insets show the literature- and CSA-reported (Porter et al., 2004) actives sites for ribonuclease F1 (1rck), hen lysozyme (1e8l), serine protease (1ah2) and HIV-1 protease (1bve) in green ball-and-stick representation. The structural regions predicted to be most critically positioned are colored pink. The two curves in the last panel (1bve) refer to the profiles of the two monomers.
Similar articles
- Principal components analysis of protein structure ensembles calculated using NMR data.
Howe PW. Howe PW. J Biomol NMR. 2001 May;20(1):61-70. doi: 10.1023/a:1011210009067. J Biomol NMR. 2001. PMID: 11430756 - COCO: a simple tool to enrich the representation of conformational variability in NMR structures.
Laughton CA, Orozco M, Vranken W. Laughton CA, et al. Proteins. 2009 Apr;75(1):206-16. doi: 10.1002/prot.22235. Proteins. 2009. PMID: 18831040 - MOBI: a web server to define and visualize structural mobility in NMR protein ensembles.
Martin AJ, Walsh I, Tosatto SC. Martin AJ, et al. Bioinformatics. 2010 Nov 15;26(22):2916-7. doi: 10.1093/bioinformatics/btq537. Epub 2010 Sep 21. Bioinformatics. 2010. PMID: 20861031 - Molecular Dynamics Simulations Combined with Nuclear Magnetic Resonance and/or Small-Angle X-ray Scattering Data for Characterizing Intrinsically Disordered Protein Conformational Ensembles.
Chan-Yao-Chong M, Durand D, Ha-Duong T. Chan-Yao-Chong M, et al. J Chem Inf Model. 2019 May 28;59(5):1743-1758. doi: 10.1021/acs.jcim.8b00928. Epub 2019 Mar 18. J Chem Inf Model. 2019. PMID: 30840442 Review. - The Protein Ensemble Database.
Varadi M, Tompa P. Varadi M, et al. Adv Exp Med Biol. 2015;870:335-49. doi: 10.1007/978-3-319-20164-1_11. Adv Exp Med Biol. 2015. PMID: 26387108 Review.
Cited by
- hdANM: a new comprehensive dynamics model for protein hinges.
Khade PM, Scaramozzino D, Kumar A, Lacidogna G, Carpinteri A, Jernigan RL. Khade PM, et al. Biophys J. 2021 Nov 16;120(22):4955-4965. doi: 10.1016/j.bpj.2021.10.017. Epub 2021 Oct 21. Biophys J. 2021. PMID: 34687719 Free PMC article. - Exploring the Conformational Impact of Glycine Receptor TM1-2 Mutations Through Coarse-Grained Analysis and Atomistic Simulations.
Mhashal AR, Yoluk O, Orellana L. Mhashal AR, et al. Front Mol Biosci. 2022 Jun 28;9:890851. doi: 10.3389/fmolb.2022.890851. eCollection 2022. Front Mol Biosci. 2022. PMID: 35836931 Free PMC article. - Molecular dynamics simulation reveals DNA-specific recognition mechanism via c-Myb in pseudo-palindromic consensus of mim-1 promoter.
Weng J, Yang S, Shen J, Liu H, Xu Y, Hao D, Wang S. Weng J, et al. J Zhejiang Univ Sci B. 2023 Sep 23;24(10):883-895. doi: 10.1631/jzus.B2200634. J Zhejiang Univ Sci B. 2023. PMID: 37752090 Free PMC article. - RNA polymerase II flexibility during translocation from normal mode analysis.
Feig M, Burton ZF. Feig M, et al. Proteins. 2010 Feb 1;78(2):434-46. doi: 10.1002/prot.22560. Proteins. 2010. PMID: 19714773 Free PMC article. - A new protein nucleic-acid coarse-grained force field based on the UNRES and NARES-2P force fields.
Sieradzan AK, Giełdoń A, Yin Y, He Y, Scheraga HA, Liwo A. Sieradzan AK, et al. J Comput Chem. 2018 Oct 30;39(28):2360-2370. doi: 10.1002/jcc.25571. Epub 2018 Oct 11. J Comput Chem. 2018. PMID: 30306573 Free PMC article.
References
- Amadei A, et al. Essential dynamics of proteins. Proteins. 1993;17:412–425. - PubMed
- Andrec M, et al. A large data set comparison of protein structures determined by crystallography and NMR: statistical test for structural differences and the effect of crystal packing. Proteins. 2007;69:449–465. - PubMed
Publication types
MeSH terms
Substances
Grants and funding
- R01 GM086238/GM/NIGMS NIH HHS/United States
- R01 LM007994/LM/NLM NIH HHS/United States
- 5R01GM086238-02/GM/NIGMS NIH HHS/United States
- 5R01LM007994-06/LM/NLM NIH HHS/United States


