Molecular mechanisms of HipA-mediated multidrug tolerance and its neutralization by HipB - PubMed (original) (raw)
Molecular mechanisms of HipA-mediated multidrug tolerance and its neutralization by HipB
Maria A Schumacher et al. Science. 2009.
Abstract
Bacterial multidrug tolerance is largely responsible for the inability of antibiotics to eradicate infections and is caused by a small population of dormant bacteria called persisters. HipA is a critical Escherichia coli persistence factor that is normally neutralized by HipB, a transcription repressor, which also regulates hipBA expression. Here, we report multiple structures of HipA and a HipA-HipB-DNA complex. HipA has a eukaryotic serine/threonine kinase-like fold and can phosphorylate the translation factor EF-Tu, suggesting a persistence mechanism via cell stasis. The HipA-HipB-DNA structure reveals the HipB-operator binding mechanism, approximately 70 degrees DNA bending, and unexpected HipA-DNA contacts. Dimeric HipB interacts with two HipA molecules to inhibit its kinase activity through sequestration and conformational inactivation. Combined, these studies suggest mechanisms for HipA-mediated persistence and its neutralization by HipB.
Figures
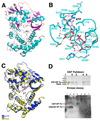
Fig. 1. HipA is a protein kinase that phosphorylates EF-Tu
(A) The E. coli apoHipA structure. β-sheets and α-helices are colored magenta and cyan, respectively. Secondary structural elements and the N- and C-termini are labeled. Disordered loops, including the putative activation loop (labeled AL), are indicated by dashed lines. This Figure and Figures 1B–C, 2A–C, 3B–D and 4A–D were made using PyMOL (30). (B) The ATP binding pocket of HipA. Shown are ATP molecule (sticks), Mg2+ ions (magenta spheres), waters (red spheres) and hydrogen bonds (dashed black lines). (C) Superimposition of the C-domains of apoHipA (yellow) and HipA-ATP-Mg2+ (blue) reveals only a small rotation upon ATP binding. The location of ATP in the HipA-ATP structure is shown as sticks. (D) Top panel shows HipA-(GST-EF-Tu) pulldown (SDS-PAGE, stained with Coomassie brilliant blue). Lanes are (1) MW ladder (2) Glutathione agarose (bead) retentate after adding GST-EF-Tu, HipA, ATP, GDP (3) Bead retentate after adding GST-EF-Tu, HipA, ATP, GDP and washing (4) Bead retentate after adding GST-EF-Tu, HipA, no GDP or ATP (5) Bead retentate after adding GST-EF-Tu, HipA, no GDP or ATP, and washing. Bottom panel wt HipA kinase assay using EF-Tu as a substrate (Immunoblot). The positions of GST-EF-Tu and Xa-cleaved EF-Tu are indicated by red and blue arrows, respectively. Lanes are (1) EF-Tu (cleaved)+wt HipA+ATP+GTP, (2) EF-Tu (cleaved)+wt HipA+ATP+GDP, (3) EF-Tu (cleaved)+inactive HipA (D309Q)+ATP+GDP, (4) EF-Tu (uncleaved)+wt HipA+ATP+GDP, (5) EF-Tu (uncleaved)+wt HipA+ATP+GTP, (6) wt HipA+ATP (7) native EF-Tu (cleaved)+ATP+GDP.
Fig. 2. Crystal structure of the HipA-HipB-DNA complex
(A) Ribbon diagram of the HipA-HipB-DNA operator complex. The two HipA monomers are blue, one subunit of the HipB dimer is colored yellow and the other orange. The N- and C-termini and secondary structural elements of one HipB subunit (orange) are labeled. β1′ is labeled for the yellow subunit. Also labeled are the N- and C-domains of each HipA molecule. The DNA is shown as sticks with carbon, nitrogen, oxygen and phosphorus atoms colored green, blue, red and magenta, respectively. (B) Superimposition of apoHipA (red) onto HipB-bound HipA (blue) showing their essentially identical conformations. For clarity, only one HipA molecule in the HipA-HipB-DNA complex is shown. (C) Close up of the HipA-HipB interaction interface. Each lateral side of the HipB dimer, labeled subunit 1 and 2, interacts with the N- and C-domains of one HipA monomer. The DNA is shown as a grey surface. For clarity, only one HipA molecule is shown as the interaction interface between the other HipA molecule and the HipB dimer is identical. The residues that contribute to the interface are labeled and shown as orange sticks for HipB and dark blue sticks for HipA.
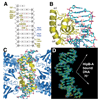
Fig. 3. HipB and HipA interactions with the hipB operator DNA
(A) Schematic representation of HipB-HipA-DNA interactions. Only one half site of the 21-mer duplex is shown as the identical contacts are made to each half site. The strands are labeled 1A–10A and 1B–10B. Bases are represented as rectangles and labeled according to sequence. The ribose groups are shown as pentagons. The operator consensus sequence, TATCC, is colored red. HipB-DNA contacts are colored yellow. Hydrophobic contacts are indicated by lines and hydrogen bonds, by arrows. Blue arrows indicate HipA-phosphate contacts. (B) HipB-DNA interactions. Only one HipB subunit-DNA half site is shown. The DNA and residues making side chain contacts are shown as sticks. The signature sequence, TATCC, is labeled in red. For clarity, only the four-helix bundle is shown and labeled. (C) HipA-DNA contacts. The HipB dimer (yellow) is shown for reference. The location of the two DNA interacting residues from HipA, K379 and R382, are shown as blue sticks and highlighted by mesh surface representations. The DNA is shown as sticks and colored as in Figure 3B. (D) HipA-HipB bound DNA is bent. Omit Fo-Fc map in which the DNA was omitted from refinement to 2.68 Å resolution. The map is contoured at 2.8 σ. The DNA is shown as sticks and the bend angle indicated.
Fig. 4. HipB is a vulnerable antitoxin that neutralizes HipA
(A) The HipB dimer is shown as ribbons with one yellow and one orange subunit. The DNA is shown as pink sticks. Hydrophobic core residues are shown as sticks and transparent surfaces. The β–lid is composed of a short two stranded β-sheet. Disordered C-terminal residues extend from the lid and are depicted as colored dashes. (B) Mutation sites (G22S and D291A) in the HipA7 protein mapped onto HipA proteins of the HipA-HipB-DNA complex. The HipA molecules are cyan, the HipB subunits are yellow and orange and the DNA is a pink ribbon. Residues G22 and D291 are shown as blue CPK. HipB residue Q62 and HipA residues S285 and L327 are also shown as CPK. A close up of the interactions involving HipA residue D291 is shown (inset). Hydrogen bonds are indicated by dashed lines. (C) Structure of the HipA(ATP)-HipB-DNA complex. HipA molecules are colored yellow, the HipB dimer is cyan, the DNA and ATP are shown as sticks. The blue mesh represents an 2.98 Å resolution Fo-Fc map, contoured at 4.0 σ in which the ATP was omitted. (D) Close up view of the ATP binding pocket and omit map. Carbon, nitrogen, oxygen and phosphorus atoms are colored magenta, blue, red and purple, respectively.
Similar articles
- HipBA-promoter structures reveal the basis of heritable multidrug tolerance.
Schumacher MA, Balani P, Min J, Chinnam NB, Hansen S, Vulić M, Lewis K, Brennan RG. Schumacher MA, et al. Nature. 2015 Aug 6;524(7563):59-64. doi: 10.1038/nature14662. Epub 2015 Jul 29. Nature. 2015. PMID: 26222023 Free PMC article. - ATP and autophosphorylation driven conformational changes of HipA kinase revealed by ion mobility and crosslinking mass spectrometry.
Wen Y, Sobott F, Devreese B. Wen Y, et al. Anal Bioanal Chem. 2016 Aug;408(21):5925-5933. doi: 10.1007/s00216-016-9709-3. Epub 2016 Jun 20. Anal Bioanal Chem. 2016. PMID: 27325463 - Autoregulation of hip, an operon that affects lethality due to inhibition of peptidoglycan or DNA synthesis.
Black DS, Irwin B, Moyed HS. Black DS, et al. J Bacteriol. 1994 Jul;176(13):4081-91. doi: 10.1128/jb.176.13.4081-4091.1994. J Bacteriol. 1994. PMID: 8021189 Free PMC article. - [Mode of action of cyclic amp in prokaryotes and eukaryotes, CAP and cAMP-dependent protein kinases].
de Gunzburg J. de Gunzburg J. Biochimie. 1985 Jun;67(6):563-82. doi: 10.1016/s0300-9084(85)80196-6. Biochimie. 1985. PMID: 2413906 Review. French. - [Three-dimensional structural view of the mechanism of Holliday junction migration].
Yamada K, Morikawa K. Yamada K, et al. Seikagaku. 2002 Oct;74(10):1251-9. Seikagaku. 2002. PMID: 12476550 Review. Japanese. No abstract available.
Cited by
- Crystal structure of the DNA-bound VapBC2 antitoxin/toxin pair from Rickettsia felis.
Maté MJ, Vincentelli R, Foos N, Raoult D, Cambillau C, Ortiz-Lombardía M. Maté MJ, et al. Nucleic Acids Res. 2012 Apr;40(7):3245-58. doi: 10.1093/nar/gkr1167. Epub 2011 Dec 2. Nucleic Acids Res. 2012. PMID: 22140099 Free PMC article. - HipA-triggered growth arrest and β-lactam tolerance in Escherichia coli are mediated by RelA-dependent ppGpp synthesis.
Bokinsky G, Baidoo EE, Akella S, Burd H, Weaver D, Alonso-Gutierrez J, García-Martín H, Lee TS, Keasling JD. Bokinsky G, et al. J Bacteriol. 2013 Jul;195(14):3173-82. doi: 10.1128/JB.02210-12. Epub 2013 May 10. J Bacteriol. 2013. PMID: 23667235 Free PMC article. - Peptide-lipid interactions of the stress-response peptide TisB that induces bacterial persistence.
Steinbrecher T, Prock S, Reichert J, Wadhwani P, Zimpfer B, Bürck J, Berditsch M, Elstner M, Ulrich AS. Steinbrecher T, et al. Biophys J. 2012 Oct 3;103(7):1460-9. doi: 10.1016/j.bpj.2012.07.060. Epub 2012 Oct 2. Biophys J. 2012. PMID: 23062338 Free PMC article. - Patients with long-term oral carriage harbor high-persister mutants of Candida albicans.
Lafleur MD, Qi Q, Lewis K. Lafleur MD, et al. Antimicrob Agents Chemother. 2010 Jan;54(1):39-44. doi: 10.1128/AAC.00860-09. Epub 2009 Oct 19. Antimicrob Agents Chemother. 2010. PMID: 19841146 Free PMC article. - Artificial Activation of Escherichia coli mazEF and hipBA Toxin-Antitoxin Systems by Antisense Peptide Nucleic Acids as an Antibacterial Strategy.
Równicki M, Pieńko T, Czarnecki J, Kolanowska M, Bartosik D, Trylska J. Równicki M, et al. Front Microbiol. 2018 Nov 26;9:2870. doi: 10.3389/fmicb.2018.02870. eCollection 2018. Front Microbiol. 2018. PMID: 30534121 Free PMC article.
References
- Lewis K. Nat. Rev. Microbiol. 2007;5:48. - PubMed
- Lewis K. Biochemistry (Mosc.) 2005;70:267. - PubMed
- Balaban NQ, Merrin J, Chait R, Kowalik L, Leibler S. Science. 2004;305:1622. - PubMed
- Bigger JW. Lancet. 1944;11:497.
Publication types
MeSH terms
Substances
Grants and funding
- AI048593/AI/NIAID NIH HHS/United States
- R01 GM061162/GM/NIGMS NIH HHS/United States
- R01 GM061162-09/GM/NIGMS NIH HHS/United States
- GM061162/GM/NIGMS NIH HHS/United States
- GM074815/GM/NIGMS NIH HHS/United States
LinkOut - more resources
Full Text Sources
Other Literature Sources
Molecular Biology Databases


