The human colon cancer methylome shows similar hypo- and hypermethylation at conserved tissue-specific CpG island shores - PubMed (original) (raw)
. 2009 Feb;41(2):178-186.
doi: 10.1038/ng.298. Epub 2009 Jan 18.
Christine Ladd-Acosta # 2 3, Bo Wen 2 3, Zhijin Wu 4, Carolina Montano 2 3, Patrick Onyango 2 3, Hengmi Cui 2 3, Kevin Gabo 2 3, Michael Rongione 2 3, Maree Webster 5, Hong Ji 2 3, James Potash 2 6, Sarven Sabunciyan 2 7, Andrew P Feinberg # 2 3
Affiliations
- PMID: 19151715
- PMCID: PMC2729128
- DOI: 10.1038/ng.298
The human colon cancer methylome shows similar hypo- and hypermethylation at conserved tissue-specific CpG island shores
Rafael A Irizarry et al. Nat Genet. 2009 Feb.
Abstract
For the past 25 years, it has been known that alterations in DNA methylation (DNAm) occur in cancer, including hypomethylation of oncogenes and hypermethylation of tumor suppressor genes. However, most studies of cancer methylation have assumed that functionally important DNAm will occur in promoters, and that most DNAm changes in cancer occur in CpG islands. Here we show that most methylation alterations in colon cancer occur not in promoters, and also not in CpG islands, but in sequences up to 2 kb distant, which we term 'CpG island shores'. CpG island shore methylation was strongly related to gene expression, and it was highly conserved in mouse, discriminating tissue types regardless of species of origin. There was a notable overlap (45-65%) of the locations of colon cancer-related methylation changes with those that distinguished normal tissues, with hypermethylation enriched closer to the associated CpG islands, and hypomethylation enriched further from the associated CpG island and resembling that of noncolon normal tissues. Thus, methylation changes in cancer are at sites that vary normally in tissue differentiation, consistent with the epigenetic progenitor model of cancer, which proposes that epigenetic alterations affecting tissue-specific differentiation are the predominant mechanism by which epigenetic changes cause cancer.
Figures
Figure 1
Most tissue-specific differential DNA methylation is located at CpG island shores. (a) An example of a T-DMR located at a CpG island shore in the PRTFDC1 gene. The upper panel is a plot of M value versus genomic location for brain (grey), liver (pink), and spleen (purple). Each point represents the methylation level of an individual sample for a given probe. The curve represents averaged smoothed M values, described in detail in the Methods. Due to the scale and standardization used, M values which range from −0.5 to 0.5 represent unmethylated sites as defined by the control probes, and values from 0.5 to 1.5 represent baseline levels of methylation. The middle panel provides the location of CpG dinucleotides with black tick marks on the x-axis. CpG density was calculated across the region using a standard density estimator and is represented by the smoothed black line. The location of the CpG island is denoted on the x-axis as an orange line. The lower panel provides gene annotation for the genomic region. The thin outer grey line represents the transcript, the thin inner lines represent a coding region. Filled in grey boxes represent exons. On the y-axis, plus and minus marks denote sense and antisense gene transcription respectively. (b) An example of a C-DMR that is located in a CpG island shore and overlaps a T-DMR. Brain (grey) is hypomethylated relative to liver (pink) and spleen (purple) tissues. Hypomethylation of colon tumor (orange) is observed in comparison to matched normal colon tissue (green) and overlaps the region of brain hypomethylation.
Figure 2
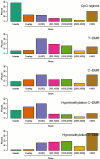
Distribution of distance of T-DMRs and C-DMRs from CpG islands. Islands (teal) are regions which cover or overlap more than 50% of a CpG island. Overlap (orange) are regions which overlap 0.1-50% of a CpG island. (0,500] (purple) are regions which do not overlap islands but are located ≤ 500 bp of islands. (500,1000] (magenta) are regions located > 500 and ≤ 1000 bp from an island. (1000,2000] (green) are regions > 1000 bp and ≤ 2000 bp from an island. (2000,3000] (yellow) are regions located > 2000 bp and ≤ 3000 bp from an island. Greater than 3000 (brown) are regions > 3000 bp from an island. The percentage of each class is provided for CpG regions (the CHARM arrays themselves, null hypothesis), tissue-specific differentially methylated regions (T-DMRs), cancer-specific differentially methylated regions (C-DMRs), and the latter subdivided into regions of cancer-specific hypermethylation and hypomethylation.
Figure 3
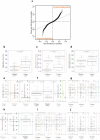
Similar numbers of sites of hypomethylation and hypermethylation in colon cancer. (a) A quantile-quantile plot shows a similar number of sites of hypomethylation and hypermethylation in colon cancer. The quantiles of the differences in M values between tumor and normal colon tissues are plotted against the quantiles of a null distribution formed using the differences seen in the control regions. Points deviating from the diagonal are not expected by chance, and a similar proportion is seen for hypomethylation and hypermethylation in cancer. (b-j) Bisulfite pyrosequencing confirms the prevalence of 5 hypermethylated and 4 hypomethylated C-DMR shores in a large set of colon tumor and normal mucosa samples. Box-plots represent DNA methylation level measured using bisulfite pyrosequencing. (b), distal-less homeobox 5 (DLX5); (c), leucine rich repeat and fibronectin type III domain containing 5 (LRFN5); (d), homeobox A3 (HOXA3); (e), SLIT and NTRKlike family, member 1 (SLITRK1); (f), FEZ family zinc finger 2 (FEZF2), (g), transmembrane protein 14A (TMEM14A); (h), glutamate-rich 1 (ERICH1); (i), family with sequence similarity 70, member B (FAM70C); (j), prostate transmembrane protein, androgen induced 1 (TMEPAI), (n) equals the number of samples analyzed by pyrosequencing.
Figure 4
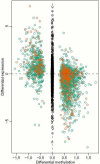
Gene expression is strongly correlated with T-DMRs at CpG island shores. For each brain versus liver T-DMR we found the closest annotated gene on the Affymetrix HGU133A microarray, resulting in a total of 2,041 gene/T-DMR pairs. Plotted are log (base 2) ratios of liver to brain expression against delta M values for liver and brain DNAm. Orange dots represent T-DMRs located within 300 bp from the corresponding gene's transcriptional start site (TSS). Green dots represent T-DMRs that are located from 300-2000 bp from the TSS of an annotated gene. Black dots, in the middle, represent log ratios for all genes further than 2 kb from an annotated TSS.
Figure 5
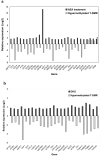
Genes downregulated in association with T-DMR shore hypermethylation are activated by 5-aza-2′-deoxycytidine treatment of colon cancer cell line HCT116 and knockout of DNA methyltrasferase 1 and 3b in HCT116. (a) Genes significantly upregulated (p<0.05) after treatment of HCT116 cells with 5-aza-2′-deoxycytidine (AZA) (black) that are also associated with a relatively hypermethylated T-DMR showing a significant change in gene expression (p<0.05) (grey). 24/28 genes are activated by AZA. (b) Genes significantly upregulated (p<0.05) after knockout of DNA methyltransferases 1 and 3b (DKO) in HCT116 cells (black) that are also associated with a relatively hypermethylated T-DMRs showing a significang change in gene expression (p<0.05) (grey). 25/25 genes are activated by DKO. Plotted are log (base 2) ratios of expression of AZA/untreated, DKO/HCT116, and relatively hypermethylated/hypomethylated tissue.
Figure 6
Clustering of human tissue samples using mouse T-DMRs results in perfect discrimination of tissues. The M values of all tissues from the 1,963 regions corresponding to mouse T-DMRs that mapped to the human genome were used for unsupervised hierarchical clustering. By definition, the mouse tissues are segregated. Surprisingly, all of the human tissues are also completely discriminated by the regions that differ in mouse tissues. The three major branches in the dendrograms correspond perfectly to tissue type regardless of species. Columns represent individual samples, and rows represent regions corresponding to mouse T-DMRs. The heatmap displays M values, with red being more methylated and blue less.
Figure 7
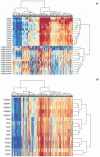
Clustering of normal tissue samples using C-DMRs results in perfect discrimination of tissues. The M values of all tissues from the 2,707 regions corresponding to C-DMRs were used for unsupervised hierarchical clustering. (a) By definition, the colon tumors and matched normal mucosa are segregated. The two major branches in the dendrograms correspond perfectly to tissue type. (b) Surprisingly, all of the normal brains, spleens and livers are also completely discriminated by the regions that differ in colon cancer. The three major branches in the dendrograms correspond perfectly to tissue type. Columns represent individual samples, and rows represent regions corresponding to C-DMRs. The heatmap displays M values, with red being more methylated and blue less.
Figure 8
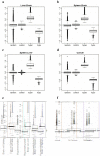
Magnitude of differential methylation and variation in C-DMRs and T-DMRs. (a-d) Boxplots of average delta M values over all DMRs, compared to randomly chosen regions and unmethylated control regions, matched for length. (a) Liver versus brain, (b) spleen versus brain, (c), spleen versus liver, (d) colon cancer versus normal colonic mucosa. (e) Differences in DNA methylation are greater in magnitude among normal tissues than are differences between colon tumors and matched normal mucosa. For all DMRs we computed the average delta M. We then stratified these values into T-DMRs, hypermethylated C-DMRs and hypomethylated C-DMRs. T-DMRs were further stratified according to brain versus liver, brain versus spleen, and liver versus spleen pairwise comparisons. The box-plots represent absolute values of the delta Ms. (f) Inter-individual variation in M is larger among colon tumors than matched normal mucosa. For each C-DMR we computed the average inter-individual standard deviation of the Mvalues. The box-plots represent these values for normal colon mucosa and colon tumors.
Similar articles
- Genome-wide profiling of DNA methylation reveals a class of normally methylated CpG island promoters.
Shen L, Kondo Y, Guo Y, Zhang J, Zhang L, Ahmed S, Shu J, Chen X, Waterland RA, Issa JP. Shen L, et al. PLoS Genet. 2007 Oct;3(10):2023-36. doi: 10.1371/journal.pgen.0030181. Epub 2007 Sep 10. PLoS Genet. 2007. PMID: 17967063 Free PMC article. - Aberrant methylation and silencing of ARHI, an imprinted tumor suppressor gene in which the function is lost in breast cancers.
Yuan J, Luo RZ, Fujii S, Wang L, Hu W, Andreeff M, Pan Y, Kadota M, Oshimura M, Sahin AA, Issa JP, Bast RC Jr, Yu Y. Yuan J, et al. Cancer Res. 2003 Jul 15;63(14):4174-80. Cancer Res. 2003. PMID: 12874023 - DNA methylation biomarker candidates for early detection of colon cancer.
Yi JM, Dhir M, Guzzetta AA, Iacobuzio-Donahue CA, Heo K, Yang KM, Suzuki H, Toyota M, Kim HM, Ahuja N. Yi JM, et al. Tumour Biol. 2012 Apr;33(2):363-72. doi: 10.1007/s13277-011-0302-2. Epub 2012 Jan 12. Tumour Biol. 2012. PMID: 22238052 Free PMC article. - CpG island hypermethylation and tumor suppressor genes: a booming present, a brighter future.
Esteller M. Esteller M. Oncogene. 2002 Aug 12;21(35):5427-40. doi: 10.1038/sj.onc.1205600. Oncogene. 2002. PMID: 12154405 Review. - Epigenetic gene silencing in cancer initiation and progression.
Nephew KP, Huang TH. Nephew KP, et al. Cancer Lett. 2003 Feb 20;190(2):125-33. doi: 10.1016/s0304-3835(02)00511-6. Cancer Lett. 2003. PMID: 12565166 Review.
Cited by
- Methylation Mesa define functional regulatory elements for targeted gene activation.
Tenen D, Bassal M, Liu Y, Suryatenggara J, Wong H, Jayasinghe M, Tang JP, Tan HK, Kwon J, Zhou Q, Ummarino S, Ebralidze A, Le M, Doench J, Chai L, Benoukraf T, Hiwase D, Thomas D, Ruscio AD. Tenen D, et al. Res Sq [Preprint]. 2024 Oct 16:rs.3.rs-4359582. doi: 10.21203/rs.3.rs-4359582/v1. Res Sq. 2024. PMID: 39483908 Free PMC article. Preprint. - Construction of a prognostic model with exosome biogenesis- and release-related genes and identification of RAB27B in immune infiltration of pancreatic cancer.
Li TY, Qin C, Zhao BB, Li ZR, Wang YY, Zhao YT, Wang WB. Li TY, et al. Transl Cancer Res. 2024 Sep 30;13(9):4846-4865. doi: 10.21037/tcr-24-54. Epub 2024 Sep 27. Transl Cancer Res. 2024. PMID: 39430819 Free PMC article. - Implementation of the Methyl-Seq platform to identify tissue- and sex-specific DNA methylation differences in the rat epigenome.
Cox OH, Seifuddin F, Guo J, Pirooznia M, Boersma GJ, Wang J, Tamashiro KLK, Lee RS. Cox OH, et al. Epigenetics. 2024 Dec;19(1):2393945. doi: 10.1080/15592294.2024.2393945. Epub 2024 Sep 22. Epigenetics. 2024. PMID: 39306700 Free PMC article. - Discovery and validation of colorectal cancer tissue-specific methylation markers: a dual-center retrospective cohort study.
Cao Q, Dan Z, Hou N, Yan L, Yuan X, Lu H, Yu S, Zhang J, Xiao H, Liu Q, Zhang X, Zhang M, Pang M. Cao Q, et al. Clin Epigenetics. 2024 Sep 7;16(1):122. doi: 10.1186/s13148-024-01735-6. Clin Epigenetics. 2024. PMID: 39244604 Free PMC article.
References
- Feinberg AP, Tycko B. The history of cancer epigenetics. Nat Rev Cancer. 2004;4:143–53. - PubMed
- Baylin SB, Ohm JE. Epigenetic gene silencing in cancer - a mechanism for early oncogenic pathway addiction? Nat Rev Cancer. 2006;6:107–16. - PubMed
- Feinberg AP, Ohlsson R, Henikoff S. The epigenetic progenitor origin of human cancer. Nat Rev Genet. 2006;7:21–33. - PubMed
Publication types
MeSH terms
Substances
Grants and funding
- R01 RR021967/RR/NCRR NIH HHS/United States
- R37 CA054358/CA/NCI NIH HHS/United States
- P50 HG003233/HG/NHGRI NIH HHS/United States
- 5R01RR021967/RR/NCRR NIH HHS/United States
- R37CA54358/CA/NCI NIH HHS/United States
- R01 GM083084/GM/NIGMS NIH HHS/United States
- R01 CA054358/CA/NCI NIH HHS/United States
- R01 GM083084-02/GM/NIGMS NIH HHS/United States
- R37 CA054358-19/CA/NCI NIH HHS/United States
- R01 RR021967-02/RR/NCRR NIH HHS/United States
- P50HG003233/HG/NHGRI NIH HHS/United States
LinkOut - more resources
Full Text Sources
Other Literature Sources
Miscellaneous

