Intracellular NAD levels regulate tumor necrosis factor protein synthesis in a sirtuin-dependent manner - PubMed (original) (raw)
Intracellular NAD levels regulate tumor necrosis factor protein synthesis in a sirtuin-dependent manner
Frédéric Van Gool et al. Nat Med. 2009 Feb.
Abstract
Tumor necrosis factor (TNF) synthesis is known to play a major part in numerous inflammatory disorders, and multiple transcriptional and post-transcriptional regulatory mechanisms have therefore evolved to dampen the production of this key proinflammatory cytokine. The high expression of nicotinamide phosphoribosyltransferase (Nampt), an enzyme involved in the nicotinamide-dependent NAD biosynthetic pathway, in cells of the immune system has led us to examine the potential relationship between NAD metabolism and inflammation. We show here that intracellular NAD concentration promotes TNF synthesis by activated immune cells. Using a positive screen, we have identified Sirt6, a member of the sirtuin family, as the NAD-dependent enzyme able to regulate TNF production by acting at a post-transcriptional step. These studies reveal a previously undescribed relationship between metabolism and the inflammatory response and identify Sirt6 and the nicotinamide-dependent NAD biosynthetic pathway as novel candidates for immunointervention in an inflammatory setting.
Conflict of interest statement
Competing financial interests: T. De Smedt is an Apoxis employee
Figures
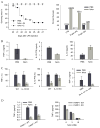
Figure 1. In vivo anti-inflammatory properties of NAm
(A) Naïve C57BL/6 mice were injected with LPS (20 mg/kg) or with a combination of a low dose of LPS (5 μg/kg) and D-galactosamine (0.75 g/kg) or with a combination of TNF (25 μg/kg) and D-galactosamine (0.75 g/kg). Survival rates were monitored daily as shown in the left panel, or determined 7 days post-injection (right panel). (B) Cytokine serum levels were determined by ELISA 90 min (TNF-α and IL-10) or 120 min (IL-12) following LPS (2 mg/kg) and PBS or NAm (500mg/kg) injection as indicated. (C) C57BL/6 mice or IL-10 KO syngenic mice were injected as in B. When indicated, mice were treated with a combination of antibodies to IL-10 (clone JES5-2A5) and to IL-10R (clone 1B1.2). (D) Wt and PARP-1 KO mice were treated as indicated in A. Serum TNF-α levels were determined 90 min after LPS injection and shown in the left panel. Purified splenic dendritic cells from wt and PARP-1 KO mice were stimulated in vitro with CpG (100 ng/ml) and TNF-α levels (right panel) determined in the supernatant of 16h cultures.
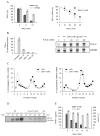
Figure 2. NAm inhibits TNF-α protein synthesis
(A) RAW 264.7 macrophages were treated or not with NAm and stimulated with 100 ng/ml of LPS. Culture media and cells were collected 2h after stimulation. TNF-α protein concentration in culture supernatant was measured by ELISA while TNF mRNA expression (normalized to GaPDH mRNA) was evaluated in cell extracts by quantitative RT-PCR (right panel). RAW264.7 cells were stimulated with 100 ng/ml LPS for 2 h. Transcription was then stopped by addition of 5 μg/ml actinomycin D (Act D) in the presence of NAm or left untreated. Cells were harvested at the time intervals shown, and TNF mRNA levels were quantified by quantitative RT-PCR. TNF/GaPDH RNA ratios were plotted as percentages of values at the time of Act D addition (left panel). (B) RAW 264.7 cells were stimulated for 2h with 100 ng/ml LPS, washed and treated for 30 min with graded doses of NAm. Relative expression of TNF-α protein levels (left panel) and mRNA (right panel) were determined respectively by ELISA and northern blot analysis. GaPDH mRNA levels were determined as internal control. (C) Polysome profile analysis of RAW 264.7 cells treated with 15 mM NAm. Densitrometric quantification of the relative RNA northern blot signal intensities across the gradient for TNF-α (left panel) and GaPDH (right panel) transcripts. Data are from one of three representative experiments. (D) RAW 264.7 cells were stimulated with LPS (100 ng/ml) for 1h, washed and incubated in cysteine- and methionine-free DMEM. 30 min later the cells were incubated in DMEM supplemented with [35S]-labeled cysteine and methionine, brefeldin A and with 15 mM NAm for the indicated time periods. Immunoprecipitated TNF-α was separated by SDS-PAGE and the gels dried and analyzed by autoradiography (NS: not stimulated by LPS). (E) 293T cells were co-transfected with plasmid encoding human TNF-α and with a plasmid encoding murine IL-2. Secreted cytokines levels were determined in the supernatant of transfected cells by ELISA. NAm was found to selectively inhibit the production of hTNF-α.
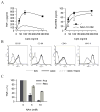
Figure 3. Immunomodulatory properties of NAm on splenic dendritic cells
(A) Purified splenic dendritic cells were stimulated with graded doses of CpG in the presence or absence of NAm (10mM) and TNF-α and RANTES levels determined in the supernatant of overnight cultures. (B) Purified dendritic cells were stained with the indicated antibodies at day 0 (immature DC, iDC) or after maturation in vitro in the absence (mDC) or in the presence of 10 mM NAm (mDC + NAm). (C) Splenic dendritic cells were stimulated with 100 ng/ml CpG and TNF-α protein concentration in culture supernatants was measured by ELISA while TNF mRNA expression (normalized to RPL-32 mRNA) was determined in cell extracts by quantitative RT-PCR.
Figure 4. Intracellular NAD levels determine TNF-α production capacities
(A) The human THP-1 cells line was incubated overnight in the presence of graded doses of the NAmPRT inhibitor APO866. Cells were than stimulated with LPS and levels of secreted TNF-α and intracellular NAD content determined 2 hours later, as indicated in the method section. (B), (C) The experiment was conducted as in (A), except that responder cells were incubated in media supplemented with the NAD precursors NA (B) or NMN (C). (D) THP-1 cells were incubated overnight in media supplemented with NA at the indicated doses and levels of secreted TNF-α and intracellular NAD content evaluated as in (A).
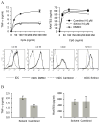
Figure 5. Immunomodulatory properties of sirtuin inhibitors
(A) Purified splenic dendritic cells were pretreated with 10 μM of the indicated sirtuin inhibitors and stimulated with graded doses of CpG in the continous presence of inhibitors. TNF-α and RANTES levels determined in the supernatant of overnight cultures. Purified dendritic cells were stained with the indicated antibodies at day 0 (immature DC, iDC) or after maturation in vitro in the presence of solvent (DMSO mDC) or 10 μM of indicated inhibitors (mDC Cambinol or mDC Sirtinol). (B) C57BL/6 mice were injected i.p. with cambinol (100 mg/kg) or its solvent (10%/10% ethanol/Cremophore solution) 1 hours before LPS treatment. The figure represents the TNF-α and RANTES serum levels of 4 individual mice in each group and is representative of three independent experiments.
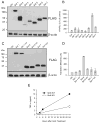
Figure 6. SIRT6 regulates TNF-α protein synthesis
(A) The human cell line 293T was transiently transfected with plasmids encoding the indicated tagged forms of murine sirtuin members. Protein expression was determined by western blot using an anti-FLAG mAb. (B) Pools of 293T cells were transiently transfected with three constructs encoding respectively for human TNF-α, mouse IL-2 and a selected murine sirtuin as indicated. The results represent the relative content of human TNF-α compared to murine IL-2 released in the supernatant during 6 hours of culture. (C) The human cell line 293T was transiently transfected with plasmids encoding the indicated tagged forms of wt and mutant forms of selected murine sirtuin members. Protein expression was determined as in (A). (D) TNF-α translation efficiency of triple transfectants, as described in (B), was determined as detailed in the text (mean of two independent experiments). (D) Bone marrow derived dendritic cells from wt and SIRT6 KO mice were stimulated with 1 μg/ml CpG and TNF-α protein levels determined in the supernatant collected at the indicated timing.
Similar articles
- Pharmacological inhibition of nicotinamide phosphoribosyltransferase/visfatin enzymatic activity identifies a new inflammatory pathway linked to NAD.
Busso N, Karababa M, Nobile M, Rolaz A, Van Gool F, Galli M, Leo O, So A, De Smedt T. Busso N, et al. PLoS One. 2008 May 21;3(5):e2267. doi: 10.1371/journal.pone.0002267. PLoS One. 2008. PMID: 18493620 Free PMC article. - Novel Mechanism for Nicotinamide Phosphoribosyltransferase Inhibition of TNF-α-mediated Apoptosis in Human Lung Endothelial Cells.
Oita RC, Camp SM, Ma W, Ceco E, Harbeck M, Singleton P, Messana J, Sun X, Wang T, Garcia JGN. Oita RC, et al. Am J Respir Cell Mol Biol. 2018 Jul;59(1):36-44. doi: 10.1165/rcmb.2017-0155OC. Am J Respir Cell Mol Biol. 2018. PMID: 29337590 Free PMC article. - Both gain and loss of Nampt function promote pressure overload-induced heart failure.
Byun J, Oka SI, Imai N, Huang CY, Ralda G, Zhai P, Ikeda Y, Ikeda S, Sadoshima J. Byun J, et al. Am J Physiol Heart Circ Physiol. 2019 Oct 1;317(4):H711-H725. doi: 10.1152/ajpheart.00222.2019. Epub 2019 Jul 26. Am J Physiol Heart Circ Physiol. 2019. PMID: 31347918 Free PMC article. - Nicotinamide phosphoribosyltransferase (Nampt): a link between NAD biology, metabolism, and diseases.
Imai S. Imai S. Curr Pharm Des. 2009;15(1):20-8. doi: 10.2174/138161209787185814. Curr Pharm Des. 2009. PMID: 19149599 Free PMC article. Review. - Nampt: linking NAD biology, metabolism and cancer.
Garten A, Petzold S, Körner A, Imai S, Kiess W. Garten A, et al. Trends Endocrinol Metab. 2009 Apr;20(3):130-8. doi: 10.1016/j.tem.2008.10.004. Epub 2008 Dec 26. Trends Endocrinol Metab. 2009. PMID: 19109034 Free PMC article. Review.
Cited by
- A Novel Role for SIRT3 in Regulating Mediators Involved in the Terminal Pathways of Human Labor and Delivery.
Lim R, Barker G, Menon R, Lappas M. Lim R, et al. Biol Reprod. 2016 Nov;95(5):95. doi: 10.1095/biolreprod.116.142372. Epub 2016 Sep 14. Biol Reprod. 2016. PMID: 27628218 Free PMC article. - Effects of hyperglycemia and aging on nuclear sirtuins and DNA damage of mouse hepatocytes.
Ghiraldini FG, Crispim AC, Mello ML. Ghiraldini FG, et al. Mol Biol Cell. 2013 Aug;24(15):2467-76. doi: 10.1091/mbc.E13-04-0186. Epub 2013 Jun 12. Mol Biol Cell. 2013. PMID: 23761075 Free PMC article. - Inflammaging and cancer: a challenge for the Mediterranean diet.
Ostan R, Lanzarini C, Pini E, Scurti M, Vianello D, Bertarelli C, Fabbri C, Izzi M, Palmas G, Biondi F, Martucci M, Bellavista E, Salvioli S, Capri M, Franceschi C, Santoro A. Ostan R, et al. Nutrients. 2015 Apr 9;7(4):2589-621. doi: 10.3390/nu7042589. Nutrients. 2015. PMID: 25859884 Free PMC article. Review. - The tuberculosis necrotizing toxin kills macrophages by hydrolyzing NAD.
Sun J, Siroy A, Lokareddy RK, Speer A, Doornbos KS, Cingolani G, Niederweis M. Sun J, et al. Nat Struct Mol Biol. 2015 Sep;22(9):672-8. doi: 10.1038/nsmb.3064. Epub 2015 Aug 3. Nat Struct Mol Biol. 2015. PMID: 26237511 Free PMC article. - SIRT6 in Aging, Metabolism, Inflammation and Cardiovascular Diseases.
Guo Z, Li P, Ge J, Li H. Guo Z, et al. Aging Dis. 2022 Dec 1;13(6):1787-1822. doi: 10.14336/AD.2022.0413. eCollection 2022 Dec 1. Aging Dis. 2022. PMID: 36465178 Free PMC article. Review.
References
- Ziegler M. New functions of a long-known molecule. Emerging roles of NAD in cellular signaling. Eur J Biochem. 2000;267:1550–64. - PubMed
- Ame JC, Spenlehauer C, de Murcia G. The PARP superfamily. Bioessays. 2004;26:882–93. - PubMed
- Guarente L. Sirtuins as potential targets for metabolic syndrome. Nature. 2006;444:868–74. - PubMed
- Vaquero A, et al. Human SirT1 interacts with histone H1 and promotes formation of facultative heterochromatin. Mol Cell. 2004;16:93–105. - PubMed
Publication types
MeSH terms
Substances
LinkOut - more resources
Full Text Sources
Other Literature Sources
Molecular Biology Databases
Miscellaneous
