Image-guided, lobe-specific hydrodynamic gene delivery to swine liver - PubMed (original) (raw)
Image-guided, lobe-specific hydrodynamic gene delivery to swine liver
Kenya Kamimura et al. Mol Ther. 2009 Mar.
Abstract
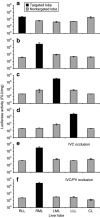
Image-guided, lobe-specific hydrodynamic gene delivery to liver was assessed in pigs. The procedure involved image-guided insertion of a balloon catheter to the hepatic vein of the selected lobe from the jugular vein and hydrodynamic injection of plasmid DNA using a newly developed computer-controlled injection device. We demonstrated that the impact of the procedure was regional with minimal effects on neighboring lobes. Level of gene expression resulted from the procedure was 10(7) relative light units (RLU)/mg in the targeted lobes and 10(2)-10(5) RLU/mg in the nontargeted lobes 4 hours after hydrodynamic injection of pCMV-Luc plasmids. Occlusion of blood flow in the inferior vena cava (IVC) or IVC plus portal vein (PV) was effective in elevating hydrodynamic pressure in the targeted vasculature but did not enhance gene delivery efficiency. Physiological examination on pigs with IVC occlusion revealed transient decreases of blood pressure and respiration rate. Removal of occlusion from IVC resulted in a rapid and transient increase in heart rate. Occlusion of the PV and hepatic vein showed no effect on physiological and cardiac activities. No major changes in serum composition were observed. These results suggest that (i) image-guided, lobe-specific hydrodynamic procedure is effective for regional gene delivery to liver, (ii) blockade in IVC should be avoided for hydrodynamic gene delivery to the liver, and (iii) clinical application of hydrodynamic gene delivery to liver is feasible.
Figures
**Figure 1
Anatomic features of pig liver. (a) Pig liver showing relative position of each of the five lobes and their conjunction. (b) Cross-section of pig liver showing major blood vessels in each lobe. (c) Endothelial surface of the hepatic vein with branching sites (arrowheads) for smaller blood vessel. (d) Endothelial surface of the inferior vena cava (IVC) inside the caudate lobe showing branching sites (arrowheads) for smaller blood vessels. LLHV, left lateral hepatic vein; LMHV, left medial hepatic vein; RLHV, right lateral hepatic vein; RMHV, right medial hepatic vein.
**Figure 2
Regional impact of lobe-specific hydrodynamic injection. Hydrodynamic injection was made to the right medial lobe (RML) (injection pressure, 300 psi; injection time, 15 seconds; injection volume, 600 ml) through the preinserted injection balloon catheter. (a) Fluoroscopic image showing location of balloon of injection catheter (arrow), occlusion balloon in inferior vena cava (IVC) (*) and in portal vein (**), and distribution of injected contrast medium in the RML. (b) Impact of hydrodynamic injection on lobe size before and 2.5, 15, and 25 seconds after injection. (c) Time-dependent volume change of the targeted RML and the nontargeted right lateral lobe (RLL).
**Figure 3
Effect of lobe-specific hydrodynamic injection on physiological functions. Hydrodynamic injection into right lateral lobe (RLL), right medial lobe (RML), left medial lobe (LML), and left lateral lobe (LLL) was performed separately (injection pressure, 300 psi; injection time, 15 seconds; injection volume; 600 ml) with occlusion of the inferior vena cava (IVC) or the IVC plus portal vein (PV), or without occlusion. The black dots in a–f show the balloon location of the injection catheter in each targeted lobe. Location of the occlusion balloons is marked in e and f (arrows). Time-dependent change upon hydrodynamic injection on intravascular pressure was detected via the transducer inserted inside the hepatic vein through the interior of the injection catheter. Changes in heart rate, systolic (upper line) and diastolic (lower line) blood pressures, and respiration rate upon hydrodynamic injection were shown in g, m, s, and y for injection to RLL; in h, n, t, and z for injection to the RML; in i, o, u, and z1 for the LML; in j, p, v, and z2 for injection to the LLL; in k, q, w, and z3 for the RML with IVC occlusion, and in l, r, x, and z4 for injection to the RML with occlusions at the IVC plus the PV, respectively. Data are representative of measurements on two pigs.
**Figure 4
Effect of occlusion removal from the inferior vena cava (IVC) on cardiac activity. An occlusion balloon (8 Fr) was inserted from the femoral vein into the IVC and the balloon was inflated for 20 seconds. (a) Electrocardiogram at different time after deflation of balloon. (b) Time-dependent heart rate after removal of occlusion balloon. (c) Cardiothoracic ratio (CTR) before, during, and after removal of occlusion balloon. Data are representative of results obtained from three pigs.
**Figure 5
Level of reporter gene expression 4 hours after hydrodynamic gene delivery. The selected lobe was injected in 15 seconds with 600 ml of saline containing pCMV-Luc plasmid DNA (100 µg/ml) with the injection pressure at 300 psi. Four hours after gene delivery, the animals were killed and a total of 15 samples from each lobe (five samples from the caudate lobe because of its small size) were collected for luciferase activity analysis. Black bars represent the level of reporter gene expression of tissue samples collected from targeted lobe and the gray bars represent that in nontargeted lobes (mean ± SD). Animals were hydrodynamically injected with pCMV-Luc plasmid into the (a) right lateral lobe (RLL, n = 2); (b) right medial lobe (RML, _n_=5); (c) left medial lobe (LML, n = 2); (d) left lateral lobe (LLL, n = 2); (e) RML (n = 2) with occlusion of the inferior vena cava (IVC); and (f) the RML (n = 2) with occlusion of the IVC plus portal vein (PV).
**Figure 6
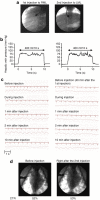
Effect of sequential hydrodynamic injection into the right medial and left medial lobes on cardiac activity. Sequential hydrodynamic injections were performed firstly into the right medial lobe (RML) and 40 minutes later into the left medial lobe (LML) of the same animal under anesthesia. (a) Fluoroscopy images of the liver showing the position of the inserted balloon in the targeted lobes. (b) Intravascular pressure change during hydrodynamic injection. (c) Electrocardiogram (upper line) and respiratory curve (lower line) of animals before, during, and after each hydrodynamic injection. (d) Cardiothoracic ratio (CTR) of the treated animal before and after the second injection. Data are representative of measurements from two pigs.
**Figure 7
Site and level of reporter gene expression in the liver after hydrodynamic gene delivery to right medial lobe (RML) and left medial lobe (LML). Sequential hydrodynamic injection into the RML and LML was performed with pCMV-Luc plasmid DNA (100 µg/ml) with an interval time of 40 minutes. The animal was killed 4 hours after the second injection and liver samples were collected from the sites displayed in a and luciferase activity was determined. (b) Average luciferase gene expression in the targeted lobes (black bars) and nontargeted lobes (gray bars) (mean ± SD). Data represent average from two pigs. CL, caudate lobe; LLL, left lateral lobe; RLL, right lateral lobe.
Similar articles
- Parameters Affecting Image-guided, Hydrodynamic Gene Delivery to Swine Liver.
Kamimura K, Suda T, Zhang G, Aoyagi Y, Liu D. Kamimura K, et al. Mol Ther Nucleic Acids. 2013 Oct 15;2(10):e128. doi: 10.1038/mtna.2013.52. Mol Ther Nucleic Acids. 2013. PMID: 24129227 Free PMC article. - Image-guided, intravascular hydrodynamic gene delivery to skeletal muscle in pigs.
Kamimura K, Zhang G, Liu D. Kamimura K, et al. Mol Ther. 2010 Jan;18(1):93-100. doi: 10.1038/mt.2009.206. Epub 2009 Sep 8. Mol Ther. 2010. PMID: 19738603 Free PMC article. - The mechanism of naked DNA uptake and expression.
Wolff JA, Budker V. Wolff JA, et al. Adv Genet. 2005;54:3-20. doi: 10.1016/S0065-2660(05)54001-X. Adv Genet. 2005. PMID: 16096005 Review. - Inferior vena cava thrombosis at its hepatic portion (obliterative hepatocavopathy).
Okuda K. Okuda K. Semin Liver Dis. 2002 Feb;22(1):15-26. doi: 10.1055/s-2002-23203. Semin Liver Dis. 2002. PMID: 11928076 Review.
Cited by
- Impact of hydrodynamic injection and phiC31 integrase on tumor latency in a mouse model of MYC-induced hepatocellular carcinoma.
Woodard LE, Keravala A, Jung WE, Wapinski OL, Yang Q, Felsher DW, Calos MP. Woodard LE, et al. PLoS One. 2010 Jun 29;5(6):e11367. doi: 10.1371/journal.pone.0011367. PLoS One. 2010. PMID: 20614008 Free PMC article. - Minicircle DNA-based gene therapy coupled with immune modulation permits long-term expression of α-L-iduronidase in mice with mucopolysaccharidosis type I.
Osborn MJ, McElmurry RT, Lees CJ, DeFeo AP, Chen ZY, Kay MA, Naldini L, Freeman G, Tolar J, Blazar BR. Osborn MJ, et al. Mol Ther. 2011 Mar;19(3):450-60. doi: 10.1038/mt.2010.249. Epub 2010 Nov 16. Mol Ther. 2011. PMID: 21081900 Free PMC article. - Gene therapy for hemophilia.
Rogers GL, Herzog RW. Rogers GL, et al. Front Biosci (Landmark Ed). 2015 Jan 1;20(3):556-603. doi: 10.2741/4324. Front Biosci (Landmark Ed). 2015. PMID: 25553466 Free PMC article. Review. - Efficient liver gene transfer with foamy virus vectors.
Zacharoulis D, Rountas C, Katsimpoulas M, Morianos J, Chatziandreou I, Vassilopoulos G. Zacharoulis D, et al. Med Sci Monit Basic Res. 2013 Aug 14;19:214-20. doi: 10.12659/MSMBR.883996. Med Sci Monit Basic Res. 2013. PMID: 23941977 Free PMC article. - Image-Guided Hydrodynamic Gene Delivery: Current Status and Future Directions.
Kamimura K, Yokoo T, Abe H, Kobayashi Y, Ogawa K, Shinagawa Y, Inoue R, Terai S. Kamimura K, et al. Pharmaceutics. 2015 Aug 21;7(3):213-23. doi: 10.3390/pharmaceutics7030213. Pharmaceutics. 2015. PMID: 26308044 Free PMC article. Review.
References
- Liu F, Song Y., and , Liu D. Hydrodynamics-based transfection in animals by systemic administration of plasmid DNA. Gene Ther. 1999;6:1258–1266. - PubMed
- Zhang G, Budker V., and , Wolff JA. High levels of foreign gene expression in hepatocytes after tail vein injections of naked plasmid DNA. Hum Gene Ther. 1999;10:1735–1737. - PubMed
- Suda T., and , Liu D. Hydrodynamic gene delivery: its principles and applications. Mol Ther. 2007;15:2063–2069. - PubMed
- Herweiier H., and , Wolff JA. Gene therapy progress and prospects: hydrodynamic gene delivery. Gene Ther. 2007;14:99–107. - PubMed
- Condiotti R, Curran MA, Nolan GP, Giladi H, Ketzinel-Gilad M, Gross E, et al. Prolonged liver-specific transgene expression by a non-primate lentiviral vector. Biochem Biophys Res Commun. 2004;320:998–1006. - PubMed
Publication types
MeSH terms
Substances
Grants and funding
- R01EB007357/EB/NIBIB NIH HHS/United States
- R01 EB002946/EB/NIBIB NIH HHS/United States
- R01 HL075542/HL/NHLBI NIH HHS/United States
- R01 HL098295/HL/NHLBI NIH HHS/United States
- R01 EB007357/EB/NIBIB NIH HHS/United States
- R29 CA072925/CA/NCI NIH HHS/United States
LinkOut - more resources
Full Text Sources
Other Literature Sources


