Age-dependent epigenetic control of differentiation inhibitors is critical for remyelination efficiency - PubMed (original) (raw)
Age-dependent epigenetic control of differentiation inhibitors is critical for remyelination efficiency
Siming Shen et al. Nat Neurosci. 2008 Sep.
Abstract
The efficiency of remyelination decreases with age, but the molecular mechanisms responsible for this decline remain only partially understood. In this study, we show that remyelination is regulated by age-dependent epigenetic control of gene expression. In demyelinated young brains, new myelin synthesis is preceded by downregulation of oligodendrocyte differentiation inhibitors and neural stem cell markers, and this is associated with recruitment of histone deacetylases (HDACs) to promoter regions. In demyelinated old brains, HDAC recruitment is inefficient, and this allows the accumulation of transcriptional inhibitors and prevents the subsequent surge in myelin gene expression. Defective remyelination can be recapitulated in vivo in mice receiving systemic administration of pharmacological HDAC inhibitors during cuprizone treatment and is consistent with in vitro results showing defective differentiation of oligodendrocyte progenitors after silencing specific HDAC isoforms. Thus, we suggest that inefficient epigenetic modulation of the oligodendrocyte differentiation program contributes to the age-dependent decline in remyelination efficiency.
Figures
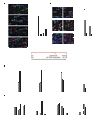
Figure 1
Complex temporal pattern of regulation of gene expression in the corpus callosum of cuprizone-treated mice. (a) Levels of myelin gene transcripts in the corpus callosum of mice treated with cuprizone (cupri), measured by qRT-PCR and normalized to Gapdh (n = 3). (b) Western blot analysis of proteins extracted from the corpus callosum of individual mice at 4 weeks (Cup4w) or 6 weeks (Cup6w), quantified by densitometry and normalized to actin levels. (c,d) qRT-PCR of Sox2, Olig1 and Mag (c) and Hes1, Hes5, Id2 and Id4 (d) in the corpus callosum of cuprizone-treated mice, normalized to Gapdh and expressed as percentage of the values in untreated mice (n = 6). (e) Levels of class1 HDAC proteins measured by western blot, quantified by densitometry and normalized to actin levels (n = 3; untreated, gray; 4 weeks cuprizone, white; 6 weeks cuprizone, black). In a–e, *P < 0.05, **P < 0.01, ***P < 0.001; n = 3; error bars, s.d. (f) Confocal image of the dorsal corpus callosum in mice treated for 4 weeks with cuprizone, stained with antibodies for HDAC1 (green) and for specific cellular markers as indicated (red). Scale bar, 20 µm; ×25 objective. (g) ChIP of samples isolated from the corpus callosum of mice treated with cuprizone for the indicated time periods (n = 8) and immunoprecipitated with antibodies for HDAC1, HDAC2 and HDAC8. NA, no-antibody control; Cup6+2w, a 2-week recovery period after 6 weeks of cuprizone treatment. The immunoprecipitated DNA was amplified using specific primer pairs for the regions surrounding the Sox2 and Hes5 (d) promoters. (h) qChIP of chromatin prepared as described in g (error bars, s.d.; n = 8).
Figure 2
The pattern of histone acetylation in oligodendrocyte progenitors in the corpus callosum of cuprizone-treated mice correlates with the expression profile of the stem cell marker Sox2 and of the differentiation inhibitor Hes5. (a) Left, confocal images of the corpus callosum of mice fed with cuprizone for 2 weeks (n = 3), stained for AcH3 (green) and for cell type specific markers (red). Scale bar, 10 µm; ×63 objective. Right, percentage of double-positive cells relative to the total number of AcH3+ cells. (b) Left, confocal image of the dorsal corpus callosum in control and cuprizone (cupri)-treated mice stained with antibodies for AcH3 (red) and Sox2 (green) or for AcH3 (green) and PDGFRα (red). Scale bar, 10 µm; ×63 objective. Right, percentage of double-positive cells relative to the total number of DAPI+ cells (**P < 0.01; n = 3). (c) Diagram of the scheme of saline or VPA administration (red line) relative to cuprizone treatment duration (black line). (d) Hes5, Sox2, Olig1 and Mag levels in the corpus callosum of treated mice, measured by qRT-PCR, normalized to Gapdh and expressed as percentage of those in untreated mice. (e) qRTPCR analysis of the same transcripts in primary proliferating (prolif.) OPCs, differentiating (diff.) OPCs, astrocytes (astro.) and microglia (micro.), treated either with cuprizone or with cuprizone and VPA. Values were normalized to Gapdh and expressed as percentage of those in proliferating OPCs (*P < 0.05; **P < 0.01; ***P < 0.001; n = 3; error bars, s.d.).
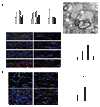
Figure 3
Systemic administration of HDAC inhibitors to cuprizone-treated mice increases histone acetylation on the promoters of Sox2 and Hes5 and prevents oligodendrocytic differentiation. (a) Confocal images of the corpus callosum of mice treated as described in Figure 2c and stained with antibodies for Sox2 (green) and for cell type specific markers (red). Scale bar, 10 µm; ×63 objective. (b) Nuclear intensity of Sox2 protein fluorescence in PDGRα+ cells in VPA treated mice normalized to the intensity detected in saline injected mice (***P <0.001; n = 60 cells; error bars, s.d.). (c) ChIP assay of the proximal region of Sox2 and Hes5 promoters in saline and VPA-treated mice immunoprecipitated with antibodies against active RNA polymerase II (RNApol II) and AcH3. Input DNA and sample without primary antibodies (NA) are shown as controls. (d) qChIP of the same region to assess the amount of RNA polymerase II (RNAPII) and of AcH3 binding (***P < 0.001; error bars, s.d.; n = 3). (e) Left, confocal images of the corpus callosum of mice treated with cuprizone (cupri) and either treated or not treated with VPA for 6 weeks, stained for PDGFRα (green) and CC1 (red). Scale bar, 10 µm; ×63 objective. Right, numbers of cells counted in the medial (mcc) and lateral (lcc) corpus callosum, normalized to the total number of DAPI+ nuclei (*P < 0.05, **P < 0.01, ***P < 0.001; error bar, s.d.; n = 6 mice).
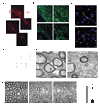
Figure 4
The impaired remyelination detected in VPA-treated mice is not dependent on axonal damage. (a–c) Confocal images of the lateral corpus callosum of cuprizone mice treated with saline (−VPA) or VPA (+VPA), stained with antibodies for MBP (a), MAG and PLP (b) and hypophosphorylated neurofilament heavy chain (SMI-32, c). White arrows, SMI-32+ axonal spheroids; DAPI (blue), nuclei. Scale bar, 10 µm; ×63 objective. (d) Scatter plot representation of SMI-32+ axonal spheroids counted in the medial (mcc) and lateral (lcc) corpus callosum of salineor VPA-treated mice. (e) Electron micrograph showing the presence of many large-caliber myelinated axons in the corpus callosum of saline-but not VPA-treated mice after 6 weeks of cuprizone diet. Note that, despite the absence of myelin sheaths, the appearance of the small and large caliber axons in the VPA mice is very similar, with evenly spaced cytoskeletal elements and the presence of mitochondria with healthy cristae, indicating healthy axons. Scale bar, 200 nm. (f) Left, electron microscopy of the corpus callosum of mice either untreated or treated for 6 weeks with cuprizone and either saline or VPA. Scale bar, 1 µm. Right, quantification of the number of myelinated axons in the corpus callosum of untreated (U), saline-treated and VPA-treated mice (***P < 0.001; error bars, s.d.).
Figure 5
Impaired recovery of myelin gene expression in old mice correlates with decreased number of HDAC+ cells and increased number of Sox2+ immature cells. (a) Transcript levels of Cnp, Mag and Olig1 in the corpus callosum of young and old mice treated with cuprizone for the indicated time, measured by qRT-PCR and normalized to the levels in untreated mice of each age group (*P < 0.05; **_P_ < 0.01; ***_P_ < 0.001; _n_ = 3). (**b**) Ultrastructure of unmyelinated axons in regions of the corpus callosum of old mice. Note the four axons that lack myelin even though they are of sufficient size for myelination (>0.3 µm) and healthy, as indicated by the presence of many cytoskeletal profiles and by the absence of axolemmal blebbing and electron-dense inclusions. Scale bar, 200 nm. (c) Left, confocal images of the corpus callosum of cuprizone-treated young and old mice stained for HDAC1, HDAC2, HDAC3 and HDAC8 (green); PDGFRα (red); and DAPI (blue). Scale bar, 10 µm; ×63 objective. Right, number of double-positive cells expressed as percentage of PDGFRα+ cells (**P < 0.01). (d) Left, confocal images of the corpus callosum of young and old untreated or cuprizone-treated mice stained for Sox2 (green), PDGFRα (red) and DAPI (blue). Right, nuclear Sox2 intensity, normalized to levels in young, untreated mice (***P < 0.001; error bars, s.d.).
Figure 6
The pattern of microglial and astrocytic gene expression is similar in the corpus callosum of young and old mice after cuprizone treatment. (a) Confocal images of corpus callosum of young and old mice either untreated or treated with cuprizone for 6 weeks, stained with CD68 (red) or Mac1 (red) to detect the macrophage or microglial population, respectively, and with DAPI (blue) for nuclei. Scale bar, 10 µm; ×63 objective. (b) Transcript levels of β-microglobulin (B2m), lysozyme (Lyz1) and chemokine ligand 3 (Ccl3) in the dorsal corpus callosum of young and old untreated (U) or cuprizone (C)-treated mice, measured by qRT-PCR, normalized to Gapdh and expressed relative to those in untreated mice of each age group. (c) Confocal images of the corpus callosum of young and old cuprizone-treated mice, stained with GFAP (red) and DAPI (blue). Scale bars, 10 µm, ×63 objective. (d) Transcript levels of Gfap and Slc1a3 (Eaat1), measured by qRT-PCR, normalized to Gapdh and expressed relative to those in untreated mice of each age group. Black line, comparison between untreated and cuprizone treated; red line, comparison between young and old treated; *P <0.05; **P < 0.01 and ***P < 0.001; error bars, s.d.; n = 3 (b,d).
Figure 7
Age-dependent and dose-independent recruitment of repressive complexes containing HDAC to Hes5 and Sox2 promoters during remyelination. (a) Confocal images of the lateral corpus callosum of mice of the indicated age and treatment with the indicated percentage of cuprizone, stained with SMI-32 (red) to identify axonal spheroids (white arrows) and with DAPI (blue). Scale bars, 10 µm. (b) Scatter plot of SMI-32+ axonal spheroids counted in the medial (mcc) and lateral (lcc) corpus callosum of these mice (*P < 0.05; NS, not significant). (c) qRT-PCR analysis of Sox2, Hes5, Id2 and Id4 transcripts in young or old mice untreated or treated with 0.2% or 0.4% cuprizone (cupri.) for 4 weeks. Values were normalized to Gapdh and expressed relative to those in untreated mice (black line, comparison between untreated and cuprizone treated; red line, comparison between young and old treated; *P < 0.05; **P < 0.01; error bars, s.d.; n = 3). (d–g) Recruitment of HDAC1, HDAC2 and HDAC8 to the indicated regions of the Sox2 (d) and Hes5 (f) promoters detected using ChIP on chromatin isolated from the corpus callosum of young (Y) and old (O) mice either untreated or treated for 4 weeks with the indicated doses of cuprizone (input and no antibody (NA) used as controls; n = 8). (e,g) Quantitative ChIP of region I of the Sox2 promoter (e) and of region II of the Hes5 promoter (g) in chromatin samples isolated from the corpus callosum of mice described in d. Bar graphs represent the enrichment of HDAC on the promoter regions relative to input DNA (error bars, s.d.).
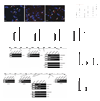
Figure 8
Selective class I HDAC isoforms are necessary for oligodendrocyte progenitor differentiation and Sox2 downregulation. (a) ChIP assay of chromatin from proliferating (prolif.) and differentiating (diff.) primary OPCs immunoprecipitated with antibodies for HDAC1, HDAC2 and HDAC8 and analyzed with primers encompassing region I of the Sox2 promoter. Values expressed as fold increase in HDAC binding to Sox2 promoter in differentiating compared to proliferating OPCs. (b) Confocal image of OPCs transfected with nontargeting siRNA (siCont) or siRNA targeting constructs specific for HDAC1 (siHD1), HDAC2 (siHD2), HDAC3 (siHD3) or HDAC8 (siHD8). After siRNA transfection, progenitors were allowed to differentiate for 3 d and were then stained with the appropriate HDAC antibody (green) to define the efficiency of silencing and with the Sox2 antibody (red). DAPI (blue) was used as nuclear counterstain. (c) Immunohistochemistry of OPCs transfected with siRNA constructs as described in b and then costained with the appropriate HDAC antibody (green) to define the efficiency of silencing and A2B5 antibody (red) as early progenitor marker or O4 (red) to identify differentiating cells.
Comment in
- Epigenetic control of myelin repair.
Popko B. Popko B. Nat Neurosci. 2008 Sep;11(9):987-8. doi: 10.1038/nn0908-987. Nat Neurosci. 2008. PMID: 18725899 Review.
Similar articles
- Remyelination after cuprizone induced demyelination is accelerated in mice deficient in the polysialic acid synthesizing enzyme St8siaIV.
Koutsoudaki PN, Hildebrandt H, Gudi V, Skripuletz T, Škuljec J, Stangel M. Koutsoudaki PN, et al. Neuroscience. 2010 Nov 24;171(1):235-44. doi: 10.1016/j.neuroscience.2010.08.070. Epub 2010 Sep 15. Neuroscience. 2010. PMID: 20833231 - Thyroid hormones promote differentiation of oligodendrocyte progenitor cells and improve remyelination after cuprizone-induced demyelination.
Franco PG, Silvestroff L, Soto EF, Pasquini JM. Franco PG, et al. Exp Neurol. 2008 Aug;212(2):458-67. doi: 10.1016/j.expneurol.2008.04.039. Epub 2008 May 15. Exp Neurol. 2008. PMID: 18572165 - The K2P -channel TASK1 affects Oligodendroglial differentiation but not myelin restoration.
Albrecht S, Korr S, Nowack L, Narayanan V, Starost L, Stortz F, Araúzo-Bravo MJ, Meuth SG, Kuhlmann T, Hundehege P. Albrecht S, et al. Glia. 2019 May;67(5):870-883. doi: 10.1002/glia.23577. Epub 2019 Jan 9. Glia. 2019. PMID: 30623969 - The neurotoxicant, cuprizone, as a model to study demyelination and remyelination in the central nervous system.
Matsushima GK, Morell P. Matsushima GK, et al. Brain Pathol. 2001 Jan;11(1):107-16. doi: 10.1111/j.1750-3639.2001.tb00385.x. Brain Pathol. 2001. PMID: 11145196 Free PMC article. Review. - Epigenetic mechanisms facilitating oligodendrocyte development, maturation, and aging.
Copray S, Huynh JL, Sher F, Casaccia-Bonnefil P, Boddeke E. Copray S, et al. Glia. 2009 Nov 15;57(15):1579-87. doi: 10.1002/glia.20881. Glia. 2009. PMID: 19373939 Free PMC article. Review.
Cited by
- Individual differences in slow wave sleep architecture relate to variation in white matter microstructure across adulthood.
Gudberg C, Stevelink R, Douaud G, Wulff K, Lazari A, Fleming MK, Johansen-Berg H. Gudberg C, et al. Front Aging Neurosci. 2022 Aug 25;14:745014. doi: 10.3389/fnagi.2022.745014. eCollection 2022. Front Aging Neurosci. 2022. PMID: 36092806 Free PMC article. - Intracellular Protein Shuttling: A Mechanism Relevant for Myelin Repair in Multiple Sclerosis?
Göttle P, Küry P. Göttle P, et al. Int J Mol Sci. 2015 Jul 3;16(7):15057-85. doi: 10.3390/ijms160715057. Int J Mol Sci. 2015. PMID: 26151843 Free PMC article. Review. - Relationships between Inflammation and Age-Related Neurocognitive Changes.
Jin R, Chan AKY, Wu J, Lee TMC. Jin R, et al. Int J Mol Sci. 2022 Oct 20;23(20):12573. doi: 10.3390/ijms232012573. Int J Mol Sci. 2022. PMID: 36293430 Free PMC article. Review. - Epigenomic Regulation of Schwann Cell Reprogramming in Peripheral Nerve Injury.
Ma KH, Hung HA, Svaren J. Ma KH, et al. J Neurosci. 2016 Aug 31;36(35):9135-47. doi: 10.1523/JNEUROSCI.1370-16.2016. J Neurosci. 2016. PMID: 27581455 Free PMC article. - Stem cell therapy for neurological disorders: A focus on aging.
Nguyen H, Zarriello S, Coats A, Nelson C, Kingsbury C, Gorsky A, Rajani M, Neal EG, Borlongan CV. Nguyen H, et al. Neurobiol Dis. 2019 Jun;126:85-104. doi: 10.1016/j.nbd.2018.09.011. Epub 2018 Sep 13. Neurobiol Dis. 2019. PMID: 30219376 Free PMC article. Review.
References
- Gensert JM, Goldman JE. Endogenous progenitors remyelinate demyelinated axons in the adult CNS. Neuron. 1997;19:197–203. - PubMed
- Dawson MR, et al. NG2-expressing glial progenitor cells: an abundant and widespread population of cycling cells in the adult rat CNS. Mol. Cell. Neurosci. 2003;24:476–488. - PubMed
- Blakemore WF. Remyelination of the superior cerebellar peduncle in the mouse following demyelination induced by feeding cuprizone. J. Neurol. Sci. 1973;20:73–83. - PubMed
- Woodruff RH, Franklin RJM. The expression of myelin protein mRNAs during remyelination of lysolecithin-induced demyelination. Neuropathol. Appl. Neurobiol. 1999;25:226–235. - PubMed
Publication types
MeSH terms
Substances
Grants and funding
- NS52738/NS/NINDS NIH HHS/United States
- R01 NS052738-03/NS/NINDS NIH HHS/United States
- R01 NS042925/NS/NINDS NIH HHS/United States
- NS042925/NS/NINDS NIH HHS/United States
- R37 NS042925/NS/NINDS NIH HHS/United States
- R01 NS042925-06/NS/NINDS NIH HHS/United States
- R01 NS052738/NS/NINDS NIH HHS/United States
LinkOut - more resources
Full Text Sources
Other Literature Sources
Medical


