mirWIP: microRNA target prediction based on microRNA-containing ribonucleoprotein-enriched transcripts - PubMed (original) (raw)
mirWIP: microRNA target prediction based on microRNA-containing ribonucleoprotein-enriched transcripts
Molly Hammell et al. Nat Methods. 2008 Sep.
Abstract
Target prediction for animal microRNAs (miRNAs) has been hindered by the small number of verified targets available to evaluate the accuracy of predicted miRNA-target interactions. Recently, a dataset of 3,404 miRNA-associated mRNA transcripts was identified by immunoprecipitation of the RNA-induced silencing complex components AIN-1 and AIN-2. Our analysis of this AIN-IP dataset revealed enrichment for defining characteristics of functional miRNA-target interactions, including structural accessibility of target sequences, total free energy of miRNA-target hybridization and topology of base-pairing to the 5' seed region of the miRNA. We used these enriched characteristics as the basis for a quantitative miRNA target prediction method, miRNA targets by weighting immunoprecipitation-enriched parameters (mirWIP), which optimizes sensitivity to verified miRNA-target interactions and specificity to the AIN-IP dataset. MirWIP can be used to capture all known conserved miRNA-mRNA target relationships in Caenorhabditis elegans at a lower false-positive rate than can the current standard methods.
Figures
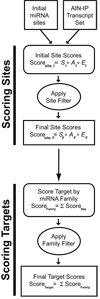
Figure 1. Flow chart for the mirWIP target prediction method
Analysis of predicted microRNA binding sites in the 3’ UTR sequences of AIN-IP transcripts reveals enriched contextual features. An initial set of predicted microRNA sites was obtained and analyzed for enriched features, and these enriched features were used to score individual predicted binding sites (see Methods and Supplemental Methods). Binding site scores were then combined into total microRNA family scores for each target, which estimates the likelihood that a given transcript is regulated by a particular microRNA family. Finally, the microRNA family scores were combined into a total target score for each transcript, estimating the likelihood that a given transcript is regulated by microRNAs (see Results, Methods and Supplemental Methods sections).
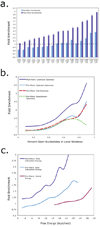
Figure 2. Characteristics of microRNA targets sites in AIN-IP Transcripts
(a) AIN-IP Transcripts are enriched for binding sites with extensive 5’ seed pairing. The horizontal axis is ordered according to final enrichment for increasing stringency in 5’ seed matches with an indicated number of G:U wobble pairs or a single bulge on the mRNA side of the duplex. The vertical axis shows the enrichment for seed matches at the indicated stringency in AIN-IP versus all other transcripts both before (light blue) and after (dark blue) implementation of the “site filter” (see Figure 1 and Supplemental Methods). Asterisks designate significant enrichments with P < 0.05. (b) AIN-IP Transcripts are enriched for binding sites that lie within structurally accessible regions. The horizontal axis shows the calculated accessibility of local sequence windows, either: across the entire binding site (red, dashed line) or within a 25 nucleotide window upstream of the binding site (light and dark blue, solid line) or downstream (green, dotted line). After applying the site filter, enrichment was calculated for upstream windows only (dark blue, solid line). c) AIN-IP transcripts are enriched for binding sites with favorable free energies. The set of conserved binding sites in AIN-IP transcripts are more likely to have favorable (i.e., negatively-valued) total hybridization energies than their counterparts in non-AIN-IP transcripts (light and dark blue lines). Also shown is hybrid energy (purple line), which reflects the stability of the final microRNA:target duplex, and corresponds to the minimal free energy (MFE). Enrichment for ∆Gtotal significantly increases after applying the site filter (dark blue line).
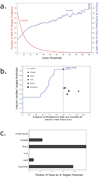
Figure 3. Sensitivity and specificity of mirWIP
(a) Choosing the optimum score threshold. The AIN-IP sensitivity of the algorithms is defined as the percent of AIN-IP targets correctly identified as a target of any microRNA (shown in red, above). The specificity of the algorithm is defined as the percentage of total predicted UTRs that are in the AIN-IP list (shown in blue, above). A compromise, for balancing the trade-off between sensitivity and specificity is defined by the point where the two curves meet: a mirWIP score threshold of 18. This corresponds to a sensitivity and specificity of approximately 40%. (b) Training mirWIP for AIN-IP sensitivity also optimizes true positive identification. A Receiver Operator Characteristic (ROC) curve is shown for mirWIP and five other microRNA prediction methods. The vertical axis shows the true positive rate (TPR), here represented by the number of verified targets correctly matched to the regulating microRNA. The horizontal axis shows the maximum false positive rate (FPR), the fraction of predicted UTRs that are not in the AIN-IP list. The performance of the mirWIP algorithm as a function of scoring threshold is shown as a blue line, and the 40% sensitivity/specificity compromise point (defined in panel a) is indicated by the large blue dot. mirWIP outperforms all five other methods by nearly doubling the TPR at a lower FPR (vertical gray line). (c) mirWIP is specific enough to reject all of the known false lsy-6 targets (Listed in Supplementary Table 1).
Figure 4. Distribution of shared microRNA predictions & non-predictions
(a,b) Since the various comparison methods differ in degree of similarity, Venn diagrams were split into two groups. MiRanda, PicTar, and TargetScanS all use seed-matching and conservation in their prediction method, so part (a) shows the degree of overlap between mirWIP, Miranda, PicTAR, and TargetScanS. mirWIP selects most of the targets for PicTAR and TargetScanS that these two methods share, and relatively few of the targets not shared by these two methods. PITA and rna22, neither of which uses conservation to identify microRNA targets are compared to mirWIP in panel (b). (c) Most AIN-IP transcripts can be accounted for by containing conserved binding sites for known microRNAs. However, 29% of the IP-ed genes do not have strong, conserved binding sites in their annotated 3’ UTRs. Conserved binding sites can be found for an additional 8% of the AIN-IP transcripts, but these sites fail to meet our minimum free energy threshold and have been termed “weak” sites. Lack of conservation and poor UTR annotation are the most likely reasons for the rest of these non-predictions. See Results and Supplemental Results for a discussion of the remaining AIN-IP transcripts rejected by mirWIP.
Similar articles
- Systematic identification of C. elegans miRISC proteins, miRNAs, and mRNA targets by their interactions with GW182 proteins AIN-1 and AIN-2.
Zhang L, Ding L, Cheung TH, Dong MQ, Chen J, Sewell AK, Liu X, Yates JR 3rd, Han M. Zhang L, et al. Mol Cell. 2007 Nov 30;28(4):598-613. doi: 10.1016/j.molcel.2007.09.014. Mol Cell. 2007. PMID: 18042455 Free PMC article. - Analysis of microRNA-target interactions by a target structure based hybridization model.
Long D, Chan CY, Ding Y. Long D, et al. Pac Symp Biocomput. 2008:64-74. Pac Symp Biocomput. 2008. PMID: 18232104 - Computational analysis of microRNA targets in Caenorhabditis elegans.
Watanabe Y, Yachie N, Numata K, Saito R, Kanai A, Tomita M. Watanabe Y, et al. Gene. 2006 Jan 3;365:2-10. doi: 10.1016/j.gene.2005.09.035. Epub 2005 Dec 13. Gene. 2006. PMID: 16356665 - Determinants of Functional MicroRNA Targeting.
Hwang H, Chang HR, Baek D. Hwang H, et al. Mol Cells. 2023 Jan 31;46(1):21-32. doi: 10.14348/molcells.2023.2157. Epub 2023 Jan 4. Mol Cells. 2023. PMID: 36697234 Free PMC article. Review. - Computational Prediction of MicroRNA Target Genes, Target Prediction Databases, and Web Resources.
Roberts JT, Borchert GM. Roberts JT, et al. Methods Mol Biol. 2017;1617:109-122. doi: 10.1007/978-1-4939-7046-9_8. Methods Mol Biol. 2017. PMID: 28540680 Review.
Cited by
- High-throughput experimental studies to identify miRNA targets directly, with special focus on the mammalian brain.
Nelson PT, Kiriakidou M, Mourelatos Z, Tan GS, Jennings MH, Xie K, Wang WX. Nelson PT, et al. Brain Res. 2010 Jun 18;1338:122-30. doi: 10.1016/j.brainres.2010.03.108. Epub 2010 Apr 7. Brain Res. 2010. PMID: 20380813 Free PMC article. Review. - Genome-wide approaches in the study of microRNA biology.
Wilbert ML, Yeo GW. Wilbert ML, et al. Wiley Interdiscip Rev Syst Biol Med. 2011 Sep-Oct;3(5):491-512. doi: 10.1002/wsbm.128. Epub 2010 Dec 31. Wiley Interdiscip Rev Syst Biol Med. 2011. PMID: 21197653 Free PMC article. Review. - siRNA off-target effects can be reduced at concentrations that match their individual potency.
Caffrey DR, Zhao J, Song Z, Schaffer ME, Haney SA, Subramanian RR, Seymour AB, Hughes JD. Caffrey DR, et al. PLoS One. 2011;6(7):e21503. doi: 10.1371/journal.pone.0021503. Epub 2011 Jul 5. PLoS One. 2011. PMID: 21750714 Free PMC article. - miR-786 regulation of a fatty-acid elongase contributes to rhythmic calcium-wave initiation in C. elegans.
Kemp BJ, Allman E, Immerman L, Mohnen M, Peters MA, Nehrke K, Abbott AL. Kemp BJ, et al. Curr Biol. 2012 Dec 4;22(23):2213-20. doi: 10.1016/j.cub.2012.09.047. Epub 2012 Nov 6. Curr Biol. 2012. PMID: 23141108 Free PMC article. - mRNA turnover rate limits siRNA and microRNA efficacy.
Larsson E, Sander C, Marks D. Larsson E, et al. Mol Syst Biol. 2010 Nov 16;6:433. doi: 10.1038/msb.2010.89. Mol Syst Biol. 2010. PMID: 21081925 Free PMC article.
References
- Lee RC, Feinbaum RL, Ambros V. The C. elegans heterochronic gene lin-4 encodes small RNAs with antisense complementarity to lin-14. Cell. 1993;75(5):843. - PubMed
- Ambros V. The functions of animal microRNAs. Nature. 2004;431(7006):350. - PubMed
- Jackson RJ, Standart N. How do microRNAs regulate gene expression? Sci STKE. 2007;2007(367):re1. - PubMed
- Vasudevan S, Tong Y, Steitz JA. Switching from repression to activation: microRNAs can up-regulate translation. Science. 2007;318(5858):1931. - PubMed
- Kloosterman WP, Plasterk RH. The diverse functions of microRNAs in animal development and disease. Dev Cell. 2006;11(4):441. - PubMed
Publication types
MeSH terms
Substances
Grants and funding
- R01 GM047869/GM/NIGMS NIH HHS/United States
- R01 GM068726/GM/NIGMS NIH HHS/United States
- GM34028/GM/NIGMS NIH HHS/United States
- HHMI/Howard Hughes Medical Institute/United States
- GM47869/GM/NIGMS NIH HHS/United States
- R01 GM034028/GM/NIGMS NIH HHS/United States
- R01 GM066826/GM/NIGMS NIH HHS/United States
- R01 GM034028-25A2/GM/NIGMS NIH HHS/United States
- GM068726/GM/NIGMS NIH HHS/United States
- GM066826/GM/NIGMS NIH HHS/United States
LinkOut - more resources
Full Text Sources
Other Literature Sources


