A method for the alignment of heterogeneous macromolecules from electron microscopy - PubMed (original) (raw)
A method for the alignment of heterogeneous macromolecules from electron microscopy
Maxim Shatsky et al. J Struct Biol. 2009 Apr.
Abstract
We propose a feature-based image alignment method for single-particle electron microscopy that is able to accommodate various similarity scoring functions while efficiently sampling the two-dimensional transformational space. We use this image alignment method to evaluate the performance of a scoring function that is based on the Mutual Information (MI) of two images rather than one that is based on the cross-correlation function. We show that alignment using MI for the scoring function has far less model-dependent bias than is found with cross-correlation based alignment. We also demonstrate that MI improves the alignment of some types of heterogeneous data, provided that the signal-to-noise ratio is relatively high. These results indicate, therefore, that use of MI as the scoring function is well suited for the alignment of class-averages computed from single-particle images. Our method is tested on data from three model structures and one real dataset.
Figures
Figure 1
Example demonstrating the feature extraction approach applied to a 50S ribosome projection. The first column shows simulated images that were computed (a) at SNR 5:1, and (b) at SNR 1:1. The second column shows the set, E, of local extreme values, where maximum values are colored red and minimum values are colored blue. The third column shows the set, S, of significant values (red for high densities and blue for low densities). Even with the increased level of noise shown in (b), the members of the two sets, S, (top rightmost and bottom rightmost images) are distributed at similar locations. The zoomed region in the top right panel shows six pixels from the set S, colored in dark blue, and the nearest pixel from the set E, colored in light blue. Three arrows are shown as examples of the directions that are defined by the vectors, F, from elements in S to elements in E.
Figure 2
Model-dependency test. A familiar photograph of Einstein is used as a model, and 1000 images of pure white noise are aligned to the model. (a) The reconstruction that is based on the use of the NCCF for alignment shows model dependency. (b) The reconstruction that is based on the use of mutual information is close to random.
Figure 3
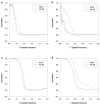
Model dependency test on synthetic data sets. Comparison of reconstructed structure resolution for NCCF and FE+MI. (a) FSC between reconstructions obtained from halves of the SF3b data when a ribosome template structure is used to align and assign Euler angles to the SF3b data. (b) FSC between reconstructions of the SF3b data and the ribosome data when a ribosome template structure is used to align and assign Euler angles to the two respective data sets. (c) FSC between reconstructions obtained from halves of the SF3b data when a SF3b template structure is used to align and assign Euler angles to the SF3b data. (d) FSC between (1) a reconstruction of the SF3b data obtained after alignment with the NCCF and FE+MI method and (2) a reconstruction of the SF3b data with no alignment error and no error in the assignment of Euler angles. A SF3b template was used to align and assign Euler angles to the SF3b data.
Figure 4
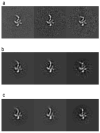
Model dependency test on synthetic data sets. (a) An example of noisy images of SF3b used for the reconstruction. (b) Reconstruction of SF3b images using the 70S ribosome as a template. First row are ribosome templates. Second row are reprojections from the cross-correlation-based reconstruction. Third row are reprojections from the mutual information-based reconstruction. Columns correspond to the same projection angle relative to the ribosome model. (c) Same as (b), with SF3b as the template model.
Figure 5
Fourier shell correlation (FSC) plots of reconstructions that were obtained after aligning the images by FE+MI and by the use of NCCF for three model conformations of the Klenow fragment of DNA polymerase I. The FSC was calculated between reconstructions in which the translational and Euler angle parameters where re-assigned using either FE+MI or NCCF and reconstructions without translational or Euler angle error. It can be seen that the FSC plots for the FE+MI reconstructions are consistently better than for the NCCF, showing that the FE+MI reconstructions more closely resemble those without errors.
Figure 6
Results from using FE+MI and NCCF for aligning experimental heterogeneous eIF3-IRES data. All images are from the same projection direction. (a) Initial class-averages resulting from focused classification, showing three distinct conformations of the IRES particle. (b) Projections at the same Euler angle as (a) for the structures resulting from FE+MI alignment. (c) Projections from the structures resulting from using NCCF for alignment. (d) Fourier ring correlation plots comparing original class-averages (a)_to results from FE+MI (b) and CCF (c). The three plots correspond to the conformations shown in columns 1, 2 and 3.
Figure 7
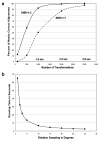
Running time measurements of FE+MI method and exhaustive transformation search implementation with MI as a scoring function. In both methods the translations are limited to at most 10 pixels from image center. (a) Transformation sampling accuracy and running time measurements for the FE+MI alignment method. The graph shows the percentage of nearly correct alignments, i.e., transformation sampling accuracy, of 50S ribosome images at SNR 1:2 and 1:7 with noise-free 70S ribosome templates. The accuracy is displayed as a function of the number of transformations employed after the pose-clustering procedure. The running time scales linearly with the number of transformations as each transformation should be evaluated with the scoring function. The running time of 2.2 seconds for 2000 transformations is equal to the time required for exhaustive rotational sampling at an angular step of 35 degrees. (b) Exhaustive search running time is displayed as a function of the size of angular steps used for rotational sampling.
Similar articles
- Optimod--an automated approach for constructing and optimizing initial models for single-particle electron microscopy.
Lyumkis D, Vinterbo S, Potter CS, Carragher B. Lyumkis D, et al. J Struct Biol. 2013 Dec;184(3):417-26. doi: 10.1016/j.jsb.2013.10.009. Epub 2013 Oct 24. J Struct Biol. 2013. PMID: 24161732 Free PMC article. - Ab initio structure determination from electron microscopic images of single molecules coexisting in different functional states.
Elmlund D, Davis R, Elmlund H. Elmlund D, et al. Structure. 2010 Jul 14;18(7):777-86. doi: 10.1016/j.str.2010.06.001. Structure. 2010. PMID: 20637414 - Determining the structure of biological macromolecules by transmission electron microscopy, single particle analysis and 3D reconstruction.
Ruprecht J, Nield J. Ruprecht J, et al. Prog Biophys Mol Biol. 2001;75(3):121-64. doi: 10.1016/s0079-6107(01)00004-9. Prog Biophys Mol Biol. 2001. PMID: 11376797 Review. - PyTom: a python-based toolbox for localization of macromolecules in cryo-electron tomograms and subtomogram analysis.
Hrabe T, Chen Y, Pfeffer S, Cuellar LK, Mangold AV, Förster F. Hrabe T, et al. J Struct Biol. 2012 May;178(2):177-88. doi: 10.1016/j.jsb.2011.12.003. Epub 2011 Dec 13. J Struct Biol. 2012. PMID: 22193517 - On cross-correlations, averages and noise in electron microscopy.
Radermacher M, Ruiz T. Radermacher M, et al. Acta Crystallogr F Struct Biol Commun. 2019 Jan 1;75(Pt 1):12-18. doi: 10.1107/S2053230X18014036. Epub 2019 Jan 1. Acta Crystallogr F Struct Biol Commun. 2019. PMID: 30605121 Free PMC article. Review.
Cited by
- Macromolecular structure modeling from 3D EM using VolRover 2.0.
Zhang Q, Bettadapura R, Bajaj C. Zhang Q, et al. Biopolymers. 2012 Sep;97(9):709-31. doi: 10.1002/bip.22052. Biopolymers. 2012. PMID: 22696407 Free PMC article. Review. - A Bayesian adaptive basis algorithm for single particle reconstruction.
Kucukelbir A, Sigworth FJ, Tagare HD. Kucukelbir A, et al. J Struct Biol. 2012 Jul;179(1):56-67. doi: 10.1016/j.jsb.2012.04.012. Epub 2012 May 1. J Struct Biol. 2012. PMID: 22564910 Free PMC article. - X-ray, Cryo-EM, and computationally predicted protein structures used in integrative modeling of HIV Env glycoprotein gp120 in complex with CD4 and 17b.
Rasheed M, Bettadapura R, Bajaj C. Rasheed M, et al. Data Brief. 2016 Jan 12;6:833-9. doi: 10.1016/j.dib.2016.01.001. eCollection 2016 Mar. Data Brief. 2016. PMID: 26937457 Free PMC article. - APPLE picker: Automatic particle picking, a low-effort cryo-EM framework.
Heimowitz A, Andén J, Singer A. Heimowitz A, et al. J Struct Biol. 2018 Nov;204(2):215-227. doi: 10.1016/j.jsb.2018.08.012. Epub 2018 Aug 19. J Struct Biol. 2018. PMID: 30134153 Free PMC article. - Toward Single Particle Reconstruction without Particle Picking: Breaking the Detection Limit.
Bendory T, Boumal N, Leeb W, Levin E, Singer A. Bendory T, et al. SIAM J Imaging Sci. 2023;16(2):886-910. doi: 10.1137/22m1503828. SIAM J Imaging Sci. 2023. PMID: 39144526 Free PMC article.
References
- Beese LS, Friedman JM, Steitz TA. Crystal structures of the Klenow fragment of DNA polymerase I complexed with deoxynucleoside triphosphate and pyrophosphate. Biochemistry. 1993;32:14095–101. - PubMed
- Borland L, van Heel M. Classification of image data in conjugate representation spaces. J Opt Soc Am. 1990;A7:601.
- Brink J, Ludtke SJ, Kong Y, Wakil SJ, Ma J, Chiu W. Experimental verification of conformational variation of human fatty acid synthase as predicted by normal mode analysis. Structure (Camb) 2004;12:185–91. - PubMed
- Burgess SA, Walker ML, Thirumurugan K, Trinick J, Knight PJ. Use of negative stain and single-particle image processing to explore dynamic properties of flexible macromolecules. J Struct Biol. 2004;147:247–58. - PubMed
- Elad N, Clare DK, Saibil HR, Orlova EV. Detection and separation of heterogeneity in molecular complexes by statistical analysis of their two-dimensional projections. Journal of Structural Biology. 2008;162:108–120. - PubMed
Publication types
MeSH terms
Substances
Grants and funding
- R01 GM073109-02/GM/NIGMS NIH HHS/United States
- R01 GM073109/GM/NIGMS NIH HHS/United States
- P01 GM064692-05/GM/NIGMS NIH HHS/United States
- GM064692/GM/NIGMS NIH HHS/United States
- P01 GM064692/GM/NIGMS NIH HHS/United States
LinkOut - more resources
Full Text Sources
Other Literature Sources


