A role for the juxtamembrane cytoplasm in the molecular dynamics of focal adhesions - PubMed (original) (raw)
A role for the juxtamembrane cytoplasm in the molecular dynamics of focal adhesions
Haguy Wolfenson et al. PLoS One. 2009.
Erratum in
- PLoS ONE. 2009;4(3). doi: 10.1371/annotation/ce274a43-a284-4839-9791-59e4b2563c9c
Abstract
Focal adhesions (FAs) are specialized membrane-associated multi-protein complexes that link the cell to the extracellular matrix and play crucial roles in cell-matrix sensing. Considerable information is available on the complex molecular composition of these sites, yet the regulation of FA dynamics is largely unknown. Based on a combination of FRAP studies in live cells, with in silico simulations and mathematical modeling, we show that the FA plaque proteins paxillin and vinculin exist in four dynamic states: an immobile FA-bound fraction, an FA-associated fraction undergoing exchange, a juxtamembrane fraction experiencing attenuated diffusion, and a fast-diffusing cytoplasmic pool. The juxtamembrane region surrounding FAs displays a gradient of FA plaque proteins with respect to both concentration and dynamics. Based on these findings, we propose a new model for the regulation of FA dynamics in which this juxtamembrane domain acts as an intermediary layer, enabling an efficient regulation of FA formation and reorganization.
Conflict of interest statement
Competing Interests: The authors have declared that no competing interests exist.
Figures
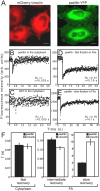
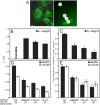
Figure 1. Typical curves demonstrating differences in paxillin and vinculin FRAP rates at different locations within the cell.
(A) HeLa-JW cells expressing paxillin-YFP or mCherry-vinculin, plated on 20 μg/ml fibronectin-coated cover slips. (B–E) Typical FRAP curves of paxillin-YFP or free GFP in HeLa-JW cells. Cells were subjected to FRAP experiments 24–48 h after plating at 37°C, using a 63× objective (see Experimental Procedures). The temporal resolution (dwell time per channel) was 6 ms for the short time scale (3-s experiments), 120 ms for the long timescale FRAP studies on paxillin-YFP (60-s experiments), and 320 ms for the long timescale experiments on mCherry-vinculin (160-s experiments). Solid lines denote the best fit of a nonlinear regression analysis, fitting to a lateral diffusion process ; the resulting τ and Rf values are shown. (B) FRAP of paxillin-YFP in the cytoplasm results in fast, complete recovery. (C) Free cytoplasmic GFP recovers instantaneously on the FRAP experimental timescale; therefore, fitting by non-linear regression was not possible. (D) FRAP of paxillin-YFP in FAs (3 s timescale). Lower Rf and slower recovery relative to cytoplasmic paxillin were observed. (E) FRAP of paxillin-YFP in FAs (60 s timescale) resulted in higher Rf and longer τ, as compared to (D). Note that fitting for τ ignored the first 6 points after the bleach, which correspond to the recovery phase shown in (D). (F) Average τ values for the subpopulations of paxillin and vinculin. Note the different timescales shown in each panel. Results represent the mean±SEM of 40–60 measurements, each conducted on a single FA within each cell and on different cells. In general, paxillin and vinculin displayed analogous patterns of dynamic subpopulations; the only major difference lay in the slow-recovering FA populations, where vinculin recovery was ∼2.5-fold slower.
Figure 2. FRAP beam-size analysis reveals two different recovery modes inside FAs.
FRAP experiments were conducted on HeLa-JW cells expressing paxillin-YFP or mCherry-vinculin, as described in Figure 1. Two beam sizes were generated using 63× and 100× objectives, and τ values were determined with each. The ratio between areas illuminated by the two beams was 1.63±0.03 (n = 59); this ratio is expected for FRAP by lateral diffusion, whereas a ratio of 1 is expected for recovery by exchange . (A) τ values derived from FRAP experiments on a short timescale (3 s). For both paxillin and vinculin, the τ(63×) differed significantly from the τ(100×) value of the same protein (**, p = 2×10⁻⁷; Student's t-test). (B) τ(63×)/τ(100×) ratios derived from (A). The τ ratio for the 3 s measurements yielded 1.59 for paxillin and 1.58 for vinculin, close to the 1.63 ratio expected for lateral diffusion (solid line) (p = 0.24 and 0.15 for paxillin and vinculin, respectively; Student's t-test). (C) τ values from FRAP experiments on long timescales (60 or 160 s). For both proteins, the τ(63×) and τ(100×) values of the same protein were similar (p = 0.38; Student's t-test). (D) τ(63×)/τ(100×) ratios derived from (C). The τ ratios (1.09 for paxillin, 1.05 for vinculin) differed significantly from the 1.63 value for diffusion (p = 4*10−23 and 4*10−25 for paxillin and vinculin, respectively; Student's t-test). These values imply a major contribution of exchange to the recovery, as they are close to the ratio of 1 predicted for pure exchange (broken line). Bars in (A) and (C) represent means±SEM of 30–60 measurements. In (B) and (D), SEM of the τ(63×)/τ(100×) ratios were calculated using bootstrap analysis.
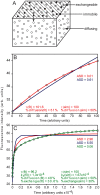
Figure 3. 3D simulation of plaque protein dynamics and fitting to analytical expressions for different FRAP mechanisms.
(A) Schematic representation of the model for plaque protein dynamics. The particles (molecules of FA plaque proteins) undergo fast 3D diffusion (random walk) in a cubic volume, and reversible binding to one of the volume boundaries (stripes). The bound molecules are assumed to be laterally immobile, to mimic FAs on the experimental timescale. A fraction of the bound molecules can, however, undergo exchange (slow, relative to the diffusion) with the free molecules. (B–C) FRAP simulations and fittings to different mechanisms. A CTRW algorithm , was used to simulate FRAP experiments in a system modeled after paxillin and vinculin dynamics in FAs. The simulation parameters were chosen to resemble those of the FRAP experiments (Figures 1 and 2). Since the Rf values of both proteins at FAs on the short timescale were around 0.50 (Figure 1D), 50% of the particles were denoted as undergoing 3D diffusion. Based on the increase in Rf to ∼0.80 on the longer timescale (Figure 1E), the remaining 50% of the particles were divided, with 30% undergoing exchange, and 20% immobile. τ for diffusion (τD) was introduced (in arbitrary units; au) as 100. To simulate a ∼60-fold slower exchange rate (see Figure 4), we introduced 1/b = _τD_×60 = 100×60 au, i.e., b = 1.67×10⁻⁴, where b represents the dissociation rate constant. (B) Short timescale. Under such conditions, the contribution of slow exchange was negligible, and it was sufficient to consider only the 3D diffusion. This was evident from the excellent fit of the data to the analytical expression for FRAP by lateral diffusion (Eq. 14; red line). Fitting to exchange (Eq. 17; blue line) was much worse (Average Squared Deviation - ASD - values are shown). Fitting to two subpopulations (Eq. 18) did not improve the fit (data not shown). The parameters derived by fitting to lateral diffusion were similar to those introduced in the simulation [panel (B)]. Thus, the analytical expression for lateral diffusion (Eq. 14) could be used to fit 3D diffusion. (C) Long timescale. At this timescale, the contribution of exchange becomes significant. The situation could be approximated by two subpopulations, one recovering by fast diffusion, and one by slow exchange (Eq. 18). Diffusion (red) or exchange (blue) alone did not fit. However, the analytical expression for two populations (Eq. 18; green) yielded a good fit. The fitted parameters were in agreement with those introduced in the simulation [Panel (C)].
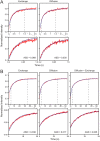
Figure 4. FRAP of paxillin in FAs fits recovery of two subpopulations by diffusion and exchange.
FRAP data for paxillin-YFP in FAs (63× objective; experimental design as in Figure 1) was fitted to the analytical expressions for FRAP by lateral diffusion, by exchange, or by diffusion and exchange (two subpopulations; Figure 3). To improve the signal-to-noise ratio, 40–60 FRAP curves were averaged in each panel by summing up the intensities of each individual curve, starting from the bleach point for synchronization. To normalize the intensities, the pre-bleach level of each curve was given a value of 1. (A) FRAP on the 3 s timescale was well-fitted by diffusion. The diffusion equation (Eq. 14, Supporting Information) yielded a good fit, while exchange (Eq. 17) was not well-fitted (see ASD values in lower panels). The τ value derived from this fit (0.15 s) was similar to that obtained by fitting each individual curve to lateral diffusion and averaging (Figure 1F; 0.16 s). The values obtained in the same manner for vinculin are depicted in Table S1. (B) FRAP of the slow-recovering fraction (60 s timescale). The fit obtained for the combination of diffusion and exchange (two subpopulations; Eq. 18) was better than the fit for each mechanism separately (see ASD values in lower panels). The fit yields τ = 0.15 s, similar to the 0.16 s value obtained for the fast-diffusing population, and b = 0.11 s−1 (i.e., 1/b = 9.09 s). Due to the much slower exchange, the process can be approximated as one subpopulation recovering by diffusion, and the other by slow exchange (see Results).
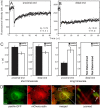
Figure 5. Paxillin and vinculin display different dynamics at the FA proximal and distal ends.
FRAP experiments were carried out as described in Figure 1, focusing the beam on the two FA ends. (A) A typical FRAP curve of paxillin-YFP at the proximal FA end (60 s timescale). This curve is similar to curves obtained in the middle of smaller FAs on the same timescale (Figure 1E). (B) A typical curve at the distal FA end (60 s timescale). Fast recovery by diffusion exists, but the ensuing exchange is very slow, preventing determination of τ. To eliminate the contribution of the fast recovery, the first 6 points after the bleach were ignored in the fitting. (C) Average τ values of paxillin-YFP and mCherry-vinculin at the two FA ends. On the short timescale (left panels), which represents 3D diffusion (Figures 1, 2 and 4), the τ values were similar at both ends, resembling those at the centers of smaller FAs. On the long timescale (right panels), there were marked differences between the two: at the proximal end, significant recovery was observed at rates resembling those at smaller adhesions, while at the distal end, recovery was too slow to be measured. (D) Paxillin co-localizes with actin at the FA proximal end. HeLa-JW cells co-expressing paxillin-YFP and mCherry-actin were visualized by fluorescence microscopy (see Experimental Procedures). Co-localization was visible at the proximal edge (solid arrow), but not at the distal edge (dashed arrow). Scale bar: 10 μm.
Figure 6. The rate of paxillin recovery outside FAs changes with distance from the FA edge.
FRAP experiments were conducted as described in Figure 1. (A) Typical HeLa-JW cells expressing paxillin-YFP are shown, demonstrating clear, highlighted FAs with large differences in fluorescence intensity between adhesion and non-adhesion areas. Scale bar: 10 μm. FRAP experiments were performed at defined distances from the FA edge (right panel; scale bar: 1 μm). The numbers represent the position of the bleached regions relative to the FA. The locations of the bleached regions are defined as follows: 0 – inside the FAs; 1 – immediately adjacent to the FA edge; 2 – one beam diameter (1.54 μm) from the FA edge; and 3 – regions >5 μm from the FA edge. (B) Average τ values at the various locations for GFP-β3-integrin. While β3-integrin was virtually immobile at FAs, it was mobile outside the FA region, and displayed a gradient of recovery rates. (C) Relative average fluorescence intensities of GFP-β3-integrin at the various locations. Fluorescence intensities were quantified by using the FRAP instrumentation under non-bleaching conditions. The intensity of GFP-β3-integrin fluorescence inside FAs (location 0) was normalized to 1. (D) Average τ values at the various locations of paxillin-YFP and mCherry-vinculin. A gradient of recovery rates was observed for both paxillin and vinculin as a function of the distance from the FA edge. (E) Relative average fluorescence intensities of paxillin-YFP and mCherry-vinculin at the various locations. The respective intensities of each protein at location 0 were normalized to 1.
Figure 7. A schematic representation of the three spatial domains defined by FA protein dynamics.
The results presented in this article point to the presence of three spatial domains within and around FAs, with distinct molecular dynamics: (i) the cytoplasm, characterized by fast-diffusing FA plaque proteins; (ii) the juxtamembrane region surrounding FAs, which extends into the z-axis as well as laterally (shaded area), where the plaque proteins display attenuated diffusion; (iii) the FA domain, containing two subpopulations of molecules, one associated with the FA surface and undergoing exchange ( ), and an immobile, FA-bound subpopulation. The model is not drawn to scale for demonstrative purposes, and specifically the distance along the z axis is exaggerated in order to clearly depict molecules with a higher local concentration in this region. The juxtamembrane zone (shaded area) is actually adjacent (just above) the FAs, and has a gradient nature that decreases gradually with the distance from the FA both in the XY plane and in the z direction (see text). Depending on the polar density of actin stress fiber tips in FAs, the plaque proteins at the two FA ends (proximal, high actin fiber density; distal, low density) display different exchange rates. We propose that the density of integrins, which is higher at the FA region but is also not negligible outside FAs, attracts FA plaque proteins by both direct and indirect binding, leading to a density gradient of FA plaque proteins, as well as to distinct domains and dynamic populations.
Similar articles
- The residence time of focal adhesion kinase (FAK) and paxillin at focal adhesions in renal epithelial cells is determined by adhesion size, strength and life cycle status.
Le Dévédec SE, Geverts B, de Bont H, Yan K, Verbeek FJ, Houtsmuller AB, van de Water B. Le Dévédec SE, et al. J Cell Sci. 2012 Oct 1;125(Pt 19):4498-506. doi: 10.1242/jcs.104273. Epub 2012 Jul 5. J Cell Sci. 2012. PMID: 22767508 - Dynamics and distribution of paxillin, vinculin, zyxin and VASP depend on focal adhesion location and orientation.
Legerstee K, Geverts B, Slotman JA, Houtsmuller AB. Legerstee K, et al. Sci Rep. 2019 Jul 18;9(1):10460. doi: 10.1038/s41598-019-46905-2. Sci Rep. 2019. PMID: 31320676 Free PMC article. - Actomyosin-generated tension controls the molecular kinetics of focal adhesions.
Wolfenson H, Bershadsky A, Henis YI, Geiger B. Wolfenson H, et al. J Cell Sci. 2011 May 1;124(Pt 9):1425-32. doi: 10.1242/jcs.077388. Epub 2011 Apr 12. J Cell Sci. 2011. PMID: 21486952 Free PMC article. - The inner lives of focal adhesions.
Wehrle-Haller B, Imhof B. Wehrle-Haller B, et al. Trends Cell Biol. 2002 Aug;12(8):382-9. doi: 10.1016/s0962-8924(02)02321-8. Trends Cell Biol. 2002. PMID: 12191915 Review. - Vinculin-p130Cas interaction is critical for focal adhesion dynamics and mechano-transduction.
Goldmann WH. Goldmann WH. Cell Biol Int. 2014 Mar;38(3):283-6. doi: 10.1002/cbin.10204. Epub 2013 Nov 27. Cell Biol Int. 2014. PMID: 24497348 Review.
Cited by
- Integration of actin dynamics and cell adhesion by a three-dimensional, mechanosensitive molecular clutch.
Case LB, Waterman CM. Case LB, et al. Nat Cell Biol. 2015 Aug;17(8):955-63. doi: 10.1038/ncb3191. Epub 2015 Jun 29. Nat Cell Biol. 2015. PMID: 26121555 Free PMC article. Review. - Force-Induced Calpain Cleavage of Talin Is Critical for Growth, Adhesion Development, and Rigidity Sensing.
Saxena M, Changede R, Hone J, Wolfenson H, Sheetz MP. Saxena M, et al. Nano Lett. 2017 Dec 13;17(12):7242-7251. doi: 10.1021/acs.nanolett.7b02476. Epub 2017 Nov 27. Nano Lett. 2017. PMID: 29052994 Free PMC article. - Correlative light and electron microscopy reveals fork-shaped structures at actin entry sites of focal adhesions.
Legerstee K, Sueters J, Abraham TE, Slotman JA, Kremers GJ, Hoogenboom JP, Houtsmuller AB. Legerstee K, et al. Biol Open. 2022 Nov 1;11(11):bio059417. doi: 10.1242/bio.059417. Epub 2022 Nov 21. Biol Open. 2022. PMID: 36409550 Free PMC article. - Dynamic redistribution of paxillin in bovine osteoblasts stimulated with adenosine 5'-triphosphate.
Silber AS, Pfau B, Tan TW, Jacob R, Jones D, Meyer T. Silber AS, et al. J Mol Histol. 2012 Oct;43(5):571-80. doi: 10.1007/s10735-012-9419-x. Epub 2012 May 5. J Mol Histol. 2012. PMID: 22556032 Free PMC article. - Differential effect of actomyosin relaxation on the dynamic properties of focal adhesion proteins.
Lavelin I, Wolfenson H, Patla I, Henis YI, Medalia O, Volberg T, Livne A, Kam Z, Geiger B. Lavelin I, et al. PLoS One. 2013 Sep 9;8(9):e73549. doi: 10.1371/journal.pone.0073549. eCollection 2013. PLoS One. 2013. PMID: 24039980 Free PMC article.
References
- Zamir E, Geiger B. Molecular complexity and dynamics of cell-matrix adhesions. J Cell Sci. 2001;114:3583–3590. - PubMed
- Geiger B, Bershadsky A, Pankov R, Yamada KM. Transmembrane crosstalk between the extracellular matrix and the cytoskeleton. Nat Rev Mol Cell Biol. 2001;2:793–805. - PubMed
- Burridge K, Chrzanowska-Wodnicka M. Focal adhesions, contractility, and signaling. Annu Rev Cell Dev Biol. 1996;12:463–518. - PubMed
- Wehrle-Haller B, Imhof BA. Actin, microtubules and focal adhesion dynamics during cell migration. Int J Biochem Cell Biol. 2003;35:39–50. - PubMed
Publication types
MeSH terms
Substances
LinkOut - more resources
Full Text Sources
Research Materials
Miscellaneous
