Oxidative Stress Increases the Number of Stress Granules in Senescent Cells and Triggers a Rapid Decrease in p21waf1/cip1 Translation - PubMed (original) (raw)
Oxidative Stress Increases the Number of Stress Granules in Senescent Cells and Triggers a Rapid Decrease in p21waf1/cip1 Translation
Xian Jin Lian et al. J Biol Chem. 2009.
Abstract
Very little is known as to how the accumulation of senescent cells during aging may affect our ability to cope with various stresses. Here we show that the assembly of stress granules (SGs) is part of the early events used by senescent cells to respond to certain stresses. Although SGs can form in response to stress during senescence activation, their number significantly increases once the cells are fully senescent. This increase correlates with a rapid decrease in the expression levels of the cyclin kinase inhibitor p21, an important activator of senescence. Throughout stress, p21 mRNA is stabilized and localizes to SGs, but only during late senescence does this localization interferes with its translation. Additionally, we observed that when the stress is relieved, senescent cells produce lower levels of p21 protein, which correlates with a small delay in SG disassembly. Therefore, our data suggest that SG formation and the reduction in p21 protein levels represent two main events by which senescent cells respond to stress.
Figures
FIGURE 1.
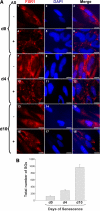
Arsenite differentially induces the formation of FXR1-contatining stress granules in proliferative and senescent IDH4 cells. A, IDH4 cells at different stages of senescence (days 0, 4, and 10) were treated for 30 min with (+) or without (-) 0.5 m
m
AS. Cells were subsequently fixed, permeabilized, and were analyzed by immunofluorescence with antibodies against FXR1 protein. Bars, 20 μ
m
. B, the_graph_ illustrates the number of FXR1-containing SGs on the different days of senescence. The number of SGs in each experiment was calculated using three random fields each containing 10 cells. Data are represented as the means of three experiments ± S.E. (error bars). DAPI, 4′,6-diamidino-2-phenylindole.
FIGURE 2.
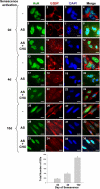
Arsenite triggers the assembly of high number of G3BP1-containing stress granules in fully senescent IDH4 cells. IDH4 induced for senescence and exposed to AS treatment as described in Fig. 1 were also grown in the presence or absence of cycloheximide (CHX). Cells were subsequently fixed, permeabilized, and were analyzed by immunofluorescence with antibodies against HuR and G3BP proteins. Bars, 20 μ
m
. The_graph_ illustrates the number of SGs formed (visualized by G3BP staining) on the different days of senescence. The number of SGs in each experiment was calculated using three random fields each containing 10 cells. Data are represented as means of three experiments ± S.E. (error bars). DAPI, 4′,6-diamidino-2-phenylindole.
FIGURE 3.
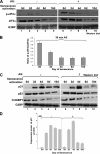
During senescence, AS treatment triggers a significant reduction in the levels of p21 proteins only in late senescent cells. A, the effect of AS on the expression levels of eIF2α and phosphorylated eIF2α (_p-eIF2_α) during senescence. Western blots using antibodies specific to phosphorylated eIF2α, eIF2α, and G3BP were performed with total cell extracts and harvested at different time points during the induction of senescence in the presence or absence of AS. Shown are representatives of two independent experiments. B, the bar graphs represent the expression level of phosphorylated eIF2α protein in each time point normalized to the expression levels of eIF2α. The intensity of the signal in each lane was measured using ImageQuant software. Each bar graph represents the ratio of phosphorylated eIF2α over eIF2α that was normalized to the intensity of G3BP for each time point. The histogram presents the results from A as a mean ± S.E. (error bars) from three independent experiments. C and D, AS-induced oxidative stress affects the expression of p21 protein only in late senescent cells. C, Western blots were performed as described in A and probed with antibodies to p21, p53, CUGBP1, and G3BP. G3BP levels were used as a loading control. D, bar graphs represent the expression levels of p21 is each time point in the presence (+) or absence (-) of AS. The expression levels of p21 are represented as ratios that were determined as described above. The histogram presents the results from C as the mean ± S.E. (error bars) from three independent experiments.
FIGURE 4.
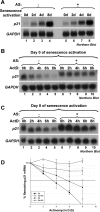
AS treatment increases the half-life of p21 mRNA in both proliferative and senescent cells. A, the increase in the steady state levels of p21 mRNA during senescence is not affected by AS. Total mRNA was prepared from IDH4 cells induced for senescence and exposed to 0.5 m
m
AS for 30 min. The expression level of p21 mRNAs was determined using 10 μg of total mRNA in a Northern blot analysis. Endogenous glyceraldehyde-3-phosphate dehydrogenase (GAPDH) mRNA was assessed as a loading control. Shown are representatives of three independent experiments. B, C, and_D_, AS stabilizes p21 mRNA in both proliferative and senescent IDH4 cells. B and C, proliferative (day 0) and senescent (day 8) IDH4 cells were treated with or without AS and then incubated with 5 μg/ml actinomycin D (ActD) for the indicated times. 25 μg (day 0) and 10 μg (day 8) of total RNA was prepared, and p21 mRNA levels were subsequently verified by Northern blot analysis. The expression of the glyceraldehyde-3-phosphate dehydrogenase mRNA was also assessed and used as a loading control. D, p21 mRNA was quantified using the ImageQuant software program, standardized against glyceraldehyde-3-phosphate dehydrogenase message, and plotted as the percentage of remaining mRNA compared with message levels at the 0 time point (where there is 100% of the maximum mRNA level). Error bars, S.D. of three independent experiments.
FIGURE 5.
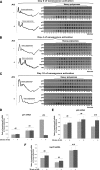
AS treatment reduces the levels of mRNAs that associate with heavy polysomes for p21 but not for p53 and hsp70. A-C, sucrose gradient polysome fractionation was performed on IDH4 cells at different stages of senescence (days 0, 4, 10) that were treated for 30 min with (+) or without (-) 0.5 m
m
AS. Absorbance at wavelength 540 was measured to observe the fractionation of the polysomes (left panels). RNA was isolated from all fractions, and slot blot analysis was performed using specific probes for p21, p53, and hsp70 mRNAs. Shown are representatives of two independent experiments. D-F, bar graphs represent the sum of the intensity of all p21, p53, or hsp70 bands that associate with heavy polysomes as indicated normalized to the sum of the 18 S band for the same fractions. The intensity of the signal in each lane was measured using ImageQuant software. Each bar graph represents the ratio of p21, p53, or hsp70 mRNAs over 18 S signals. The histogram presents the results from A as a mean ± S.E. (error bars) from two independent experiments.
FIGURE 6.
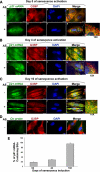
p21 mRNA is recruited to stress granules in both proliferative and senescent cells when exposed to AS. A-D, proliferative and senescent IDH4 cells were incubated with AS (0.5 m
m
) for 30 min. The cells were then fixed, permeabilized, and incubated with digoxigenin-labeled in vitro transcribed antisense probe to detect p21 mRNA (A-C) and with sense RNA probe (D) as a control (Ctr probe). Detection of G3BP with anti-G3BP antibodies enabled the visualization of SGs. Representative images of three independent experiments are shown for each day. Bars, 20 μm. E, the percentage of p21 mRNA-containing SGs was determined by comparing the number of p21-mRNAs positive SGs (green) to the total number of SGs as defined by G3BP antibody. The number of p21 mRNA- and G3BP-containing SGs were counted for 10 random cells in a field; three random fields were used, and the average number per field was calculated. The % of p21-mRNA-containing SGs was plotted for each day of senescence. Data are represented as the means of three independent experiments ± S.E. (error bars). DAPI, 4′,6-diamidino-2-phenylindole.
FIGURE 7.
After the removal of AS treatment, the expression levels of p21 protein recover to lower maximal levels in cells at late senescence when compared with their counterparts at an earlier senescent state. A and_B_, early (day 4) and late (day 10) senescent IDH4 cells were incubated with AS (0.5 m
m
) for 30 min. Cells were subsequently washed twice with PBS, replenished with fresh media, and incubated for various periods of time at 37 °C. Western blots, performed with total cell extracts prepared from these cells, were analyzed using antibodies specific to p21 and G3BP (used as the loading control). B, graph illustrating the quantified p21 protein levels in A normalized against G3BP loading control for each time points during recovery. Data are represented as means of three independent experiments ± S.E. (error bars).O/N, overnight.
Similar articles
- Stress granules counteract senescence by sequestration of PAI-1.
Omer A, Patel D, Lian XJ, Sadek J, Di Marco S, Pause A, Gorospe M, Gallouzi IE. Omer A, et al. EMBO Rep. 2018 May;19(5):e44722. doi: 10.15252/embr.201744722. Epub 2018 Mar 28. EMBO Rep. 2018. PMID: 29592859 Free PMC article. - Autophagy and heat-shock response impair stress granule assembly during cellular senescence.
Omer A, Patel D, Moran JL, Lian XJ, Di Marco S, Gallouzi IE. Omer A, et al. Mech Ageing Dev. 2020 Dec;192:111382. doi: 10.1016/j.mad.2020.111382. Epub 2020 Oct 10. Mech Ageing Dev. 2020. PMID: 33049246 - Differential roles for cyclin-dependent kinase inhibitors p21 and p16 in the mechanisms of senescence and differentiation in human fibroblasts.
Stein GH, Drullinger LF, Soulard A, Dulić V. Stein GH, et al. Mol Cell Biol. 1999 Mar;19(3):2109-17. doi: 10.1128/MCB.19.3.2109. Mol Cell Biol. 1999. PMID: 10022898 Free PMC article. - RNA granules: the good, the bad and the ugly.
Thomas MG, Loschi M, Desbats MA, Boccaccio GL. Thomas MG, et al. Cell Signal. 2011 Feb;23(2):324-34. doi: 10.1016/j.cellsig.2010.08.011. Epub 2010 Sep 8. Cell Signal. 2011. PMID: 20813183 Free PMC article. Review. - Stress granules: sites of mRNA triage that regulate mRNA stability and translatability.
Kedersha N, Anderson P. Kedersha N, et al. Biochem Soc Trans. 2002 Nov;30(Pt 6):963-9. doi: 10.1042/bst0300963. Biochem Soc Trans. 2002. PMID: 12440955 Review.
Cited by
- WRN modulates translation by influencing nuclear mRNA export in HeLa cancer cells.
Iglesias-Pedraz JM, Fossatti-Jara DM, Valle-Riestra-Felice V, Cruz-Visalaya SR, Ayala Felix JA, Comai L. Iglesias-Pedraz JM, et al. BMC Mol Cell Biol. 2020 Oct 14;21(1):71. doi: 10.1186/s12860-020-00315-9. BMC Mol Cell Biol. 2020. PMID: 33054770 Free PMC article. - Stress granules in cancer: Adaptive dynamics and therapeutic implications.
Jia Y, Jia R, Dai Z, Zhou J, Ruan J, Chng W, Cai Z, Zhang X. Jia Y, et al. iScience. 2024 Jun 22;27(8):110359. doi: 10.1016/j.isci.2024.110359. eCollection 2024 Aug 16. iScience. 2024. PMID: 39100690 Free PMC article. Review. - Could stress granules be involved in age-related diseases?
Gallouzi IE. Gallouzi IE. Aging (Albany NY). 2009 Sep 21;1(9):753-7. doi: 10.18632/aging.100090. Aging (Albany NY). 2009. PMID: 20157563 Free PMC article. No abstract available. - Sensitization of FOLFOX-resistant colorectal cancer cells via the modulation of a novel pathway involving protein phosphatase 2A.
Narayan S, Raza A, Mahmud I, Koo N, Garrett TJ, Law ME, Law BK, Sharma AK. Narayan S, et al. iScience. 2022 Jun 3;25(7):104518. doi: 10.1016/j.isci.2022.104518. eCollection 2022 Jul 15. iScience. 2022. PMID: 35754740 Free PMC article. - Melatonin: Regulation of Biomolecular Condensates in Neurodegenerative Disorders.
Loh D, Reiter RJ. Loh D, et al. Antioxidants (Basel). 2021 Sep 17;10(9):1483. doi: 10.3390/antiox10091483. Antioxidants (Basel). 2021. PMID: 34573116 Free PMC article. Review.
References
- Collado, M., Blasco, M. A., and Serrano, M. (2007) Cell 130 223-233 - PubMed
- Campisi, J., and d'Adda di Fagagna, F. (2007) Nat. Rev. Mol. Cell Biol. 8 729-740 - PubMed
- Roberson, R. S., Kussick, S. J., Vallieres, E., Chen, S. Y., and Wu, D. Y. (2005) Cancer Res. 65 2795-2803 - PubMed
- Campisi, J. (2007) Aging Cell 6 261-263 - PubMed
- Campisi, J. (2003) Nat. Rev. Cancer 3 339-349 - PubMed
MeSH terms
Substances
LinkOut - more resources
Full Text Sources
