Heterosexual risk of HIV-1 infection per sexual act: systematic review and meta-analysis of observational studies - PubMed (original) (raw)
Review
Heterosexual risk of HIV-1 infection per sexual act: systematic review and meta-analysis of observational studies
Marie-Claude Boily et al. Lancet Infect Dis. 2009 Feb.
Abstract
We did a systematic review and meta-analysis of observational studies of the risk of HIV-1 transmission per heterosexual contact. 43 publications comprising 25 different study populations were identified. Pooled female-to-male (0.04% per act [95% CI 0.01-0.14]) and male-to-female (0.08% per act [95% CI 0.06-0.11]) transmission estimates in high-income countries indicated a low risk of infection in the absence of antiretrovirals. Low-income country female-to-male (0.38% per act [95% CI 0.13-1.10]) and male-to-female (0.30% per act [95% CI 0.14-0.63]) estimates in the absence of commercial sex exposure (CSE) were higher. In meta-regression analysis, the infectivity across estimates in the absence of CSE was significantly associated with sex, setting, the interaction between setting and sex, and antenatal HIV prevalence. The pooled receptive anal intercourse estimate was much higher (1.7% per act [95% CI 0.3-8.9]). Estimates for the early and late phases of HIV infection were 9.2 (95% CI 4.5-18.8) and 7.3 (95% CI 4.5-11.9) times larger, respectively, than for the asymptomatic phase. After adjusting for CSE, presence or history of genital ulcers in either couple member increased per-act infectivity 5.3 (95% CI 1.4-19.5) times versus no sexually transmitted infection. Study estimates among non-circumcised men were at least twice those among circumcised men. Low-income country estimates were more heterogeneous than high-income country estimates, which indicates poorer study quality, greater heterogeneity of risk factors, or under-reporting of high-risk behaviour. Efforts are needed to better understand these differences and to quantify infectivity in low-income countries.
Figures
Figure 1
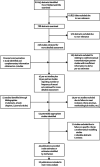
Flowchart summarising results of the search on heterosexual per-act HIV-1 transmission probabilities. The 11 publications rejected on specific criteria consisted in four mathematical modelling studies,,,, two obsolete abstracts,- and five reviews,,-. The 43 publications included 26 publications included in the principle meta-analysis and seven publications only included in the sub-analyses by risk factor,,,,,,. The remaining publications were duplicates and not included in any analysis but are shown in Webonly table 1 for completion.
Figure 2
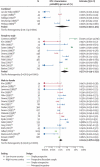
Forest plots of crude per-act study estimates in the absence of commercial sex exposure for: a) Combined M-to-F and F-to-M estimates; b) F-to-M; and c) M-to-F HIV transmission. The point estimate, sample size (N) and 95%CI for each study are represented. The indice ‘d’ indicates that the 95%CI were derived from available data. The indice “i” indicates that the estimate and CI were derived from information provided in main study; the indice “r” indicates that the original rate estimates and CI were converted into probabilities. For reference, a vertical dotted line is shown at 0·001 because this has previously been a commonly cited value for HIV-1 per-act transmission probability. Light and dark blue lines show estimates from simple prospective and prospective-discordant couple studies, respectively. Green and red lines show estimates from simple retrospective and retrospective-partner studies, respectively. Triangles identify developing country estimates. Circles identify developed country estimates. Note that only the lower bound of the 95%CI of Cameron et al and Satten et al estimates appear on the F-to-M transmission forest plot because they are too large. “L” and “R” denote the prospective-discordant-couple and retrospective-partner-study components of Downs et al, respectively.
Similar articles
- Does per-act HIV-1 transmission risk through anal sex vary by gender? An updated systematic review and meta-analysis.
Baggaley RF, Owen BN, Silhol R, Elmes J, Anton P, McGowan I, van der Straten A, Shacklett B, Dang Q, Swann EM, Bolton DL, Boily MC. Baggaley RF, et al. Am J Reprod Immunol. 2018 Nov;80(5):e13039. doi: 10.1111/aji.13039. Epub 2018 Sep 2. Am J Reprod Immunol. 2018. PMID: 30175479 Free PMC article. - Sexual relationships, risk behaviour, and condom use in the spread of sexually transmitted infections to heterosexual men.
Evans BA, Bond RA, MacRae KD. Evans BA, et al. Genitourin Med. 1997 Oct;73(5):368-72. doi: 10.1136/sti.73.5.368. Genitourin Med. 1997. PMID: 9534746 Free PMC article. - Increases in HIV Incidence Following Receptive Anal Intercourse Among Women: A Systematic Review and Meta-analysis.
Stannah J, Silhol R, Elmes J, Owen B, Shacklett BL, Anton P, McGowan I, van der Straten A, Dimitrov D, Baggaley RF, Boily MC. Stannah J, et al. AIDS Behav. 2020 Mar;24(3):667-681. doi: 10.1007/s10461-019-02651-0. AIDS Behav. 2020. PMID: 31486008 Free PMC article. - Rethinking the heterosexual infectivity of HIV-1: a systematic review and meta-analysis.
Powers KA, Poole C, Pettifor AE, Cohen MS. Powers KA, et al. Lancet Infect Dis. 2008 Sep;8(9):553-63. doi: 10.1016/S1473-3099(08)70156-7. Epub 2008 Aug 4. Lancet Infect Dis. 2008. PMID: 18684670 Free PMC article. Review. - HIV transmission risk through anal intercourse: systematic review, meta-analysis and implications for HIV prevention.
Baggaley RF, White RG, Boily MC. Baggaley RF, et al. Int J Epidemiol. 2010 Aug;39(4):1048-63. doi: 10.1093/ije/dyq057. Epub 2010 Apr 20. Int J Epidemiol. 2010. PMID: 20406794 Free PMC article. Review.
Cited by
- Brief communication: The cohort of women prescribed HIV PrEP at the Veterans Health Administration.
Keddem S, Broderick K, Van Epps P, Roberts CB, Chhatre S, Beste LA. Keddem S, et al. AIDS Res Ther. 2024 Nov 1;21(1):78. doi: 10.1186/s12981-024-00670-z. AIDS Res Ther. 2024. PMID: 39487544 Free PMC article. - Minimally Modified HIV-1 Infection of Macaques: Development, Utility, and Limitations of Current Models.
Sharma M, Nag M, Del Prete GQ. Sharma M, et al. Viruses. 2024 Oct 16;16(10):1618. doi: 10.3390/v16101618. Viruses. 2024. PMID: 39459950 Free PMC article. Review. - The impact of sex on HIV immunopathogenesis and therapeutic interventions.
Mihealsick E, Word A, Scully EP. Mihealsick E, et al. J Clin Invest. 2024 Sep 17;134(18):e180075. doi: 10.1172/JCI180075. J Clin Invest. 2024. PMID: 39286972 Free PMC article. Review. - Development and calibration of a mathematical model of HIV outcomes among Rwandan adults: informing equitable achievement of targets in Rwanda.
Kimmel AD, Pan Z, Brazier E, Murenzi G, Muhoza B, Yotebieng M, Anastos K, Nash D. Kimmel AD, et al. medRxiv [Preprint]. 2024 Sep 7:2024.09.06.24313223. doi: 10.1101/2024.09.06.24313223. medRxiv. 2024. PMID: 39281751 Free PMC article. Preprint. - Can platform use patterns be an indicator of HIV-related risk and sub-group heterogeneity among men who have sex with men in Singapore: a latent class analysis.
Tavitian-Exley I, Hao Y, Chen MI, Wong CS, Kwok C, Toh MPHS. Tavitian-Exley I, et al. Front Public Health. 2024 Apr 26;12:1330282. doi: 10.3389/fpubh.2024.1330282. eCollection 2024. Front Public Health. 2024. PMID: 38737858 Free PMC article.
References
- Brewer TH, Hasbun J, Ryan CA, et al. Migration, ethnicity and environment: HIV risk factors for women on the sugar cane plantations of the Dominican Republic. AIDS. 1998;12(14):1879–87. - PubMed
- Fiscus SA, Adimora AA, Schoenbach VJ, et al. Perinatal HIV infection and the effect of zidovudine therapy on transmission in rural and urban counties. JAMA. 1996;275(19):1483–8. - PubMed
- Harris NS, Thomson SJ, Call R, et al. Zidovudine and perinatal human immunodeficiency virus type 1 transmission: a population-based approach. Pediatrics. 2002;109(4):e60. - PubMed
- Thaithumyanon P, Thisyakorn U, Limpongsanurak S, et al. Intrapartum and neonatal zidovudine treatment in reduction of perinatal HIV-1 transmission in Bangkok. J Med Assoc Thai. 2001;84(9):1229–34. - PubMed
- Baggaley RF, Boily MC, White RG, Alary M. Systematic review of HIV-1 transmission probabilities in absence of antiretroviral therapy. UNAIDS report. 2004
Publication types
MeSH terms
Grants and funding
- G0501499/MRC_/Medical Research Council/United Kingdom
- GR082623MA/WT_/Wellcome Trust/United Kingdom
- 078499/WT_/Wellcome Trust/United Kingdom
- GR078499MA/WT_/Wellcome Trust/United Kingdom
- G0700837/MRC_/Medical Research Council/United Kingdom
- WT_/Wellcome Trust/United Kingdom
- 082623/WT_/Wellcome Trust/United Kingdom
- U01 AI068615/AI/NIAID NIH HHS/United States
- 5U01AI068615/AI/NIAID NIH HHS/United States
LinkOut - more resources
Full Text Sources
Medical

