Beta1 integrins differentially control extravasation of inflammatory cell subsets into the CNS during autoimmunity - PubMed (original) (raw)
Beta1 integrins differentially control extravasation of inflammatory cell subsets into the CNS during autoimmunity
Martina Bauer et al. Proc Natl Acad Sci U S A. 2009.
Abstract
Inhibiting the alpha(4) subunit of the integrin heterodimers alpha(4)beta(1) and alpha(4)beta(7) with the monoclonal antibody natalizumab is an effective treatment for multiple sclerosis (MS). However, the pharmacological action of natalizumab is not understood conclusively. Previous studies suggested that natalizumab inhibits activation, proliferation, or extravasation of inflammatory cells. To specify which mechanisms, cell types, and alpha(4) heterodimers are affected by the antibody treatment, we studied MS-like experimental autoimmune encephalomyelitis (EAE) in mice lacking the beta(1)-integrin gene either in all hematopoietic cells or selectively in T lymphocytes. Our results show that T cells critically rely on beta(1) integrins to accumulate in the central nervous system (CNS) during EAE, whereas CNS infiltration of beta(1)-deficient myeloid cells remains unaffected, suggesting that T cells are the main target of anti-alpha(4)-antibody blockade. We demonstrate that beta(1)-integrin expression on encephalitogenic T cells is critical for EAE development, and we therefore exclude alpha(4)beta(7) as a target integrin of the antibody treatment. T cells lacking beta(1) integrin are unable to firmly adhere to CNS endothelium in vivo, whereas their priming and expansion remain unaffected. Collectively, these results suggest that the primary action of natalizumab is interference with T cell extravasation via inhibition of alpha(4)beta(1) integrins.
Conflict of interest statement
The authors declare no conflict of interest.
Figures
Fig. 1.
The clinical course of EAE is not altered in β1−/− BMCs. (A) Knockout efficiency for the indicated total and magnetically activated, cell-sorted populations was determined by Southern blotting. The number of samples for each population is given in each bar. Bars represent medians and interquartile ranges. (B) The relative weight normalized to day 0 and the clinical disease score of control and β1−/− BMCs with active EAE are shown. Data points indicate means of 13 mice from 3 independent experiments. Around day 16, mice were killed for histological and flow cytometric analyses. (C) Immunostaining of the spinal cord white matter of control and β1−/− BMCs with ongoing active EAE (clinical score 3) and healthy control mice. Infiltrating leukocytes were stained with Ly5.2, CD4, or Mac-1 antibodies (red), blood vessels were stained with a pan-laminin antibody (green), and nuclei were stained with DAPI (blue). (Scale bar, 100 μm.)
Fig. 2.
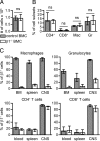
T lymphocytes depend on β1 integrins to enter the CNS. (A) Leukocytes and microglia cells were isolated from the brain and spinal cord of control or β1−/− BMCs with ongoing active EAE. Shown is the median number of isolated cells per CNS (average clinical score = 3, n = 5). (B and C) The isolated leukocytes were analyzed by flow cytometry. In B, the relative numbers of CD4+ T cells (CD4+), CD8+ T cells (CD8+), macrophages (Mac), and granulocytes (Gr) are shown (controls n = 8, β1−/− n = 9). (C) The β1 expression of the 4 leukocyte subsets was analyzed. Microglia cells are mainly host cell-derived and were excluded based on their cell surface expression of Ly-5.1. Each bar represents at least 5 mice. Bars in all panels represent medians and interquartile ranges.
Fig. 3.
β1 Integrin on T cells is important for EAE development. (A) Splenocytes from control (ctrl), β1fl/fl/MxCre+, or β1fl/fl/CD4Cre+ mice were stimulated unspecifically in vitro. Isotype control staining (iso) and β1-integrin expression of CD4+ T cells were analyzed by FACS. Shown are the medians and interquartile ranges of at least 5 animals. (B) The median day of disease onset of control and β1fl/fl/CD4Cre+ mice with active EAE is shown. (C) The clinical disease score of control and β1fl/fl/CD4Cre+ mice with active EAE is shown. Data points indicate means of 7 mice from 3 independent experiments. (D) Leukocytes and microglia cells were isolated by density gradient centrifugation from the CNS of control (n = 2) and β1fl/fl/CD4Cre+ (n = 3) mice with ongoing active EAE at day 31. The β1 expression of CD4+ and CD8+ T cells that were isolated from the CNS was quantified. Bars represent medians and interquartile ranges. (E) Shown are representative histograms of those T lymphocytes or of unspecifically stimulated splenocytes isolated from the same mice. Blue and red histograms represent control and β1−/− T cells, respectively. Isotype control stainings are shown in shaded gray histograms. (F) The clinical disease score of WT mice injected with encephalitogenic control or β1−/− MOG35–55-specific T cells is shown. Data points indicate means (controls n = 11, β1−/− n = 8; 4 independent experiments). The number of animals with EAE symptoms was compared by the Fisher exact test for each day (days 14–16: P < 0.05, days 17 and 18: P < 0.01, days 19 and 20: P < 0.005).
Fig. 4.
β1 Deficiency does not influence T cell proliferation and polarization. (A) Proliferation of control (ctrl) or β1−/− T cells was analyzed by flow cytometry. The division and proliferation index and the percentage of dividing cells were calculated from the generation sizes (n = 6). (B) CFSE stainings from 1 representative control and β1−/− sample are shown. Light gray-shaded histograms represent control animals that received DCs without OVA323–339 peptide. (C) Shown are the percentages of cytokine-expressing T cells. The intracellular cytokine expression of control and β1−/− T lymphocytes was analyzed by FACS. Bars represent medians and interquartile ranges (controls n = 4, β1−/− n = 5). ns, not significant.
Fig. 5.
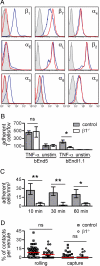
In vivo firm adhesion of β1−/− T lymphocytes to the spinal cord microvasculature is dramatically reduced. (A) Integrin expression of proliferating control (blue) and β1−/− T lymphocytes (red) was analyzed by FACS. Isotype control stainings are shown in shaded gray histograms. Histograms are representative of 3 independent experiments. (B) Adhesion of T cell blasts to the endothelioma cell lines bEnd5 (WT) and bEndI1.1 (ICAM-1−/−) at room temperature. Graphs show medians and interquartile ranges of adherent T cells per field of view (fov) (n = 4). (C) Firm adhesion of control and β1−/− T cell blasts to the spinal cord microvascular wall was analyzed by IVM in WT mice with ongoing active EAE. Firm adhesion was analyzed 10 min, 30 min, and 1 h after infusion of T cells. Bars represent medians and interquartile ranges (n = 6). (D) Initial contact events of T cell blasts with endothelial cells were analyzed by IVM. From 6 experiments with control and β1−/− T cells, 46 and 30 vessels were analyzed, respectively. Shown is the percentage of rolling or captured T cells among the total number of T cells passing through a given venule during a 1-min observation period. Each dot represents one vessel, and the red line indicates the median. ns, not significant.
Similar articles
- Antagonizing the α4β1 integrin, but not α4β7, inhibits leukocytic infiltration of the central nervous system in rhesus monkey experimental autoimmune encephalomyelitis.
Haanstra KG, Hofman SO, Lopes Estêvão DM, Blezer EL, Bauer J, Yang LL, Wyant T, Csizmadia V, 't Hart BA, Fedyk ER. Haanstra KG, et al. J Immunol. 2013 Mar 1;190(5):1961-73. doi: 10.4049/jimmunol.1202490. Epub 2013 Jan 30. J Immunol. 2013. PMID: 23365083 - The blood-central nervous system barriers actively control immune cell entry into the central nervous system.
Engelhardt B. Engelhardt B. Curr Pharm Des. 2008;14(16):1555-65. doi: 10.2174/138161208784705432. Curr Pharm Des. 2008. PMID: 18673197 - Anti-alpha4 integrin therapy for multiple sclerosis: mechanisms and rationale.
Rice GP, Hartung HP, Calabresi PA. Rice GP, et al. Neurology. 2005 Apr 26;64(8):1336-42. doi: 10.1212/01.WNL.0000158329.30470.D0. Neurology. 2005. PMID: 15851719 Review. - Beneficial effect of modified peptide inhibitor of alpha4 integrins on experimental allergic encephalomyelitis in Lewis rats.
van der Laan LJ, van der Goes A, Wauben MH, Ruuls SR, Döpp EA, De Groot CJ, Kuijpers TW, Elices MJ, Dijkstra CD. van der Laan LJ, et al. J Neurosci Res. 2002 Jan 15;67(2):191-9. doi: 10.1002/jnr.10095. J Neurosci Res. 2002. PMID: 11782963 - Natalizumab: targeting alpha4-integrins in multiple sclerosis.
Engelhardt B, Kappos L. Engelhardt B, et al. Neurodegener Dis. 2008;5(1):16-22. doi: 10.1159/000109933. Neurodegener Dis. 2008. PMID: 18075270 Review.
Cited by
- Long-term decrease in VLA-4 expression and functional impairment of dendritic cells during natalizumab therapy in patients with multiple sclerosis.
de Andrés C, Teijeiro R, Alonso B, Sánchez-Madrid F, Martínez ML, Guzmán de Villoria J, Fernández-Cruz E, Sánchez-Ramón S. de Andrés C, et al. PLoS One. 2012;7(4):e34103. doi: 10.1371/journal.pone.0034103. Epub 2012 Apr 4. PLoS One. 2012. PMID: 22496780 Free PMC article. - Role of β1 integrin in tissue homing of neutrophils during sepsis.
Sarangi PP, Hyun YM, Lerman YV, Pietropaoli AP, Kim M. Sarangi PP, et al. Shock. 2012 Aug;38(3):281-7. doi: 10.1097/SHK.0b013e31826136f8. Shock. 2012. PMID: 22683734 Free PMC article. - Integrin α4β1 is necessary for CD4+ T cell-mediated protection against genital Chlamydia trachomatis infection.
Davila SJ, Olive AJ, Starnbach MN. Davila SJ, et al. J Immunol. 2014 May 1;192(9):4284-93. doi: 10.4049/jimmunol.1303238. Epub 2014 Mar 21. J Immunol. 2014. PMID: 24659687 Free PMC article. - Intercellular Adhesion Molecule-1 (ICAM-1) and ICAM-2 Differentially Contribute to Peripheral Activation and CNS Entry of Autoaggressive Th1 and Th17 Cells in Experimental Autoimmune Encephalomyelitis.
Haghayegh Jahromi N, Marchetti L, Moalli F, Duc D, Basso C, Tardent H, Kaba E, Deutsch U, Pot C, Sallusto F, Stein JV, Engelhardt B. Haghayegh Jahromi N, et al. Front Immunol. 2020 Jan 14;10:3056. doi: 10.3389/fimmu.2019.03056. eCollection 2019. Front Immunol. 2020. PMID: 31993059 Free PMC article. - T-bet-dependent NKp46+ innate lymphoid cells regulate the onset of TH17-induced neuroinflammation.
Kwong B, Rua R, Gao Y, Flickinger J Jr, Wang Y, Kruhlak MJ, Zhu J, Vivier E, McGavern DB, Lazarevic V. Kwong B, et al. Nat Immunol. 2017 Oct;18(10):1117-1127. doi: 10.1038/ni.3816. Epub 2017 Aug 14. Nat Immunol. 2017. PMID: 28805812 Free PMC article.
References
- McFarland HF, Martin R. Multiple sclerosis: A complicated picture of autoimmunity. Nat Immunol. 2007;8:913–919. - PubMed
- Yednock TA, et al. Prevention of experimental autoimmune encephalomyelitis by antibodies against α4β1 integrin. Nature. 1992;356:63–66. - PubMed
- Ransohoff RM. Natalizumab for multiple sclerosis. N Engl J Med. 2007;356:2622–2629. - PubMed
- Polman CH, et al. A randomized, placebo-controlled trial of natalizumab for relapsing multiple sclerosis. N Engl J Med. 2006;354:899–910. - PubMed
- Berlin C, et al. α4 integrins mediate lymphocyte attachment and rolling under physiologic flow. Cell. 1995;80:413–422. - PubMed
Publication types
MeSH terms
Substances
LinkOut - more resources
Full Text Sources
Other Literature Sources
Molecular Biology Databases


