Dendritic cell-nerve clusters are sites of T cell proliferation in allergic airway inflammation - PubMed (original) (raw)
Dendritic cell-nerve clusters are sites of T cell proliferation in allergic airway inflammation
Tibor Z Veres et al. Am J Pathol. 2009 Mar.
Abstract
Interactions between T cells and dendritic cells in the airway mucosa precede secondary immune responses to inhaled antigen. The purpose of this study was to identify the anatomical locations where dendritic cell-T cell interactions occur, resulting in T cells activation by dendritic cells. In a mouse model of allergic airway inflammation, we applied whole-mount immunohistology and confocal microscopy to visualize dendritic cells and T cells together with nerves, epithelium, and smooth muscle in three dimensions. Proliferating T cells were identified by the detection of the incorporation of the nucleotide analogue 5-ethynyl-2'-deoxyuridine into the DNA. We developed a novel quantification method that enabled the accurate determination of cell-cell contacts in a semi-automated fashion. Dendritic cell-T cell interactions occurred beneath the smooth muscle layer, but not in the epithelium. Approximately 10% of the dendritic cells were contacted by nerves, and up to 4% of T cells formed clusters with these dendritic cells. T cells that were clustered with nerve-contacting dendritic cells proliferated only in the airways of mice with allergic inflammation but not in the airways of negative controls. Taken together, these results suggest that during the secondary immune response, sensory nerves influence dendritic cell-driven T cell activation in the airway mucosa.
Figures
Figure 1
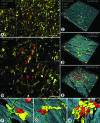
Confocal images showing the spatial relationship of T cells, DCs, and sensory nerves in the course of an allergic airway inflammation. Mice were sensitized to OVA/Alum intraperitoneally on days 0, 14, and 21, and exposed to OVA aerosol on days 27, 28, and 35. On day 36, animals were sacrificed, the lungs were fixed, and the main axial pathway of the left lobe was stained as a whole-mount against EYFP, CD5, and CGRP. A: Low-magnification image of the airway mucosa taken at the proximal part of the main axial pathway showing the distribution of CD11c-EYFP+ DCs, CD5+ T cells, and CGRP+ sensory fibers (maximum-intensity projection of 25 optical sections scanned with an interval of 2.7 μm, beginning from the airway lumen. Scale bar = 100 μm). B: Boxed region in A scanned at higher resolution (100 optical slices with an interval of 0.6 μm. Scale bar = 50 μm), inset shows more DCs with dendritic morphology and fewer T cells in the mucosa of a PBS-challenged animal without airway inflammation. Scale bar = 50μm. C–E: Three-dimensional reconstructions of the dataset shown in (B) via surface rendering (DCs, T cells, and nerves) and volume rendering (epithelium and smooth muscle layer, revealed by F-actin staining). C and D show the luminal side of the airway mucosa. In (D), the epithelium was virtually removed (via changing intensity thresholds in the F-actin channel) for a better view of the underlying cells. (E) shows the albuminal side of the dataset, where the majority of T cells are located (grid spacing = 20 μm). F and G: larger magnifications of the two boxed regions in (E) showing a T cell in contact with a nerve-contacting DC (F) and a T cell in contact with a DC located at the proximity of nerves (G). H: Large, rounded DC forming a cluster with many T cells (from an image taken at a different location of the same specimen).
Figure 2
Quantitative analysis of the distribution of T cells DCs in the airway wall in the course of an allergic airway inflammation. Two confocal image stacks were taken at each airway generation from (0) to (7–9) and surface objects of each fluorescence channel were generated to estimate the number of DCs (A) and T cells (B). The results are expressed as number of cells beneath 1 mm2 area of airway epithelium. Data are shown as mean ± SEM (*P < 0.05 and **P < 0.01 versus OVA/PBS, n = 5). Open bars, OVA/PBS; solid bars, OVA/OVA.
Figure 3
Quantitative analysis of cell-cell contacts between DCs, T cells, and sensory nerves in the airway wall in the course of an allergic airway inflammation. Contacts are displayed as the number of DCs in contact with nerves (A), number of T cells in contact with DCs (B), number of T cells in contact with nerve-contacting DCs (C), and number of T cells in contact with nerves (D), calculated as number of cells in contact beneath 1 mm2 airway epithelium. Data are shown as mean ± SEM (*P < 0.05 and **P < 0.01 versus OVA/PBS, n = 5). Open bars, OVA/PBS; solid bars, OVA/OVA.
Figure 4
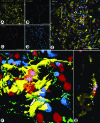
Visualization of proliferating T cells together with DCs and nerves in the airway wall in the course of an allergic airway inflammation. Mice were sensitized to OVA/Alum intraperitoneally on days 0, 14, and 21, and exposed to OVA aerosol on days 27, 28, and 35. Three hours after the last OVA aerosol challenge, animals received 1 mg EdU i.p. On day 36, animals were sacrificed, the lungs were fixed, and the main axial pathway of the left lobe was treated with EdU detection reagents to label EdU-incorporating nuclei. Subsequently, the specimens were stained as whole-mounts against EYFP, CD5, and CGRP. A–E: Confocal image taken at the proximal part of the main axial pathway showing the distribution of CD11c-EYFP+ DCs (A), CGRP+ sensory fibers (B), CD5+ T cells (C), and EdU+ nuclei of proliferating cells (D). E: Merged representation of the images shown in A–D. (maximum-intensity projection of 80 optical sections scanned with an interval of 0.6 μm, beginning from the airway lumen. Scale bar = 100 μm). Arrows point at EdU+ T cells. F: Three-dimensional reconstructions of the boxed region in (E) via surface rendering (DCs, T cells, and nerves) and volume rendering (EdU+ cell nuclei). T cells are made transparent for the visualization of EdU+ nuclei of two T cells (black arrows) located on the surface of a large DC, which is contacted by a nerve fiber (white arrow, grid spacing = 20 μm). G: Side-view (maximum-intensity projection) of the region between the two dashed lines in (F) showing an “extended” cross section of the T cells with EdU+ nuclei (arrows) associated with a DC contacted by a CGRP+ nerve fiber (double arrow).
Figure 5
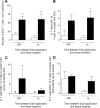
Quantitative analysis of EdU+ T cells and their contacts with DCs and nerve-contacting DCs in course of an allergic airway inflammation. EdU was applied 20 hours or 1 hour before sacrifice and tissue analysis. Four confocal image stacks were taken at the proximal half of the main axial pathway and surface objects of DCs, T cells, and nerves were generated to identify the proportion of cells involved in contacts. Inside T cells, mean fluorescence intensity of the EdU channel was measured to identify EdU+ T cells. A: Number of EdU+ T cells in the airway wall, calculated as cell number beneath 1 mm2 airway epithelium. B: Percentage of EdU+ T cells in contact with DCs, calculated from the total number of T cells in contact with DCs. C: Percentage of EdU+ T cells in contact with nerve-contacting DCs, calculated from the total number of T cells in contact with nerve-contacting DCs. D: Percentage of EdU+ T cells in contact with DCs without nerve contact, calculated from the total number of T cells in contact with DCs without nerve contact. Data are shown as mean ± SEM (*P < 0.05 and **P < 0.01 versus OVA/PBS, n = 6, #no events detected). Open bars, OVA/PBS; solid bars, OVA/OVA.
Figure 6
Electron microscopic representation of DC-sensory nerve proximity sites. Pre-embedding immunohistochemistry for CGRP and EYFP followed by transmission electron-microscopy. A: A dendritic cell process (asterisk) is situated next to a nerve fiber bundle being surrounded by a perineurial sheath (arrow) containing myelinated (m) and non-myelinated (nm) axons (smc = smooth muscle cells, e = epithelium). B: An unlabeled process of a non-neuronal cell (asterisk) establishes direct contact with the plasma membrane of a dendritic cell (DC; n = nucleus of the dendritic cell; el = elastic lamella in the epithelial basal membrane; sc = secretory epithelial cell). C: Both CGRP-immunoreactive (asterisk) and non-reactive axons (arrows) are observed within the same Schwann-cell covering at close proximity to the cell body and processes of a DC. Collagen fibrils (c) are still interposed between the axons and the dendritic cell, whereas a non-neuronal cell process was in intimate contact with the DC (inset) (n = nucleus of the DC; arrowhead = cis-terna of endoplasmic reticulum in the non-neuronal cell process).
Figure 7
The proposed model of DC-T cell-nerve interactions in the inflamed airway mucosa. DCs form two networks in the airway wall: one just beneath the epithelium and a second one, located deeper, beneath the smooth muscle. Some DCs in both networks are contacted by sensory C-fibers, as demonstrated earlier. DCs beneath the epithelium capture inhaled antigens by extending their pseudopods into the airway lumen and then migrate to the deeper layers of the airway wall to present their antigen to resident T cells beneath the smooth muscle layer. This local T cell activation, which results in subsequent T cell proliferation, can be influenced by sensory fibers contacting the DCs via the release of the neuropeptides CGRP and SP.
Similar articles
- Spatial interactions between dendritic cells and sensory nerves in allergic airway inflammation.
Veres TZ, Rochlitzer S, Shevchenko M, Fuchs B, Prenzler F, Nassenstein C, Fischer A, Welker L, Holz O, Müller M, Krug N, Braun A. Veres TZ, et al. Am J Respir Cell Mol Biol. 2007 Nov;37(5):553-61. doi: 10.1165/rcmb.2007-0087OC. Epub 2007 Jun 28. Am J Respir Cell Mol Biol. 2007. PMID: 17600312 - Aeroallergen challenge promotes dendritic cell proliferation in the airways.
Veres TZ, Voedisch S, Spies E, Valtonen J, Prenzler F, Braun A. Veres TZ, et al. J Immunol. 2013 Feb 1;190(3):897-903. doi: 10.4049/jimmunol.1200220. Epub 2012 Dec 24. J Immunol. 2013. PMID: 23267021 - Cutting edge: Limiting MHC class II expression to dendritic cells alters the ability to develop Th2- dependent allergic airway inflammation.
Niu N, Laufer T, Homer RJ, Cohn L. Niu N, et al. J Immunol. 2009 Aug 1;183(3):1523-7. doi: 10.4049/jimmunol.0901349. Epub 2009 Jul 13. J Immunol. 2009. PMID: 19596982 - Why are dendritic cells important in allergic diseases of the respiratory tract?
Upham JW, Stumbles PA. Upham JW, et al. Pharmacol Ther. 2003 Oct;100(1):75-87. doi: 10.1016/s0163-7258(03)00094-9. Pharmacol Ther. 2003. PMID: 14550506 Review. - The role of dendritic and epithelial cells as master regulators of allergic airway inflammation.
Lambrecht BN, Hammad H. Lambrecht BN, et al. Lancet. 2010 Sep 4;376(9743):835-43. doi: 10.1016/S0140-6736(10)61226-3. Lancet. 2010. PMID: 20816550 Review.
Cited by
- The diversity of neuroimmune circuits controlling lung inflammation.
Cremin M, Schreiber S, Murray K, Tay EXY, Reardon C. Cremin M, et al. Am J Physiol Lung Cell Mol Physiol. 2023 Jan 1;324(1):L53-L63. doi: 10.1152/ajplung.00179.2022. Epub 2022 Nov 21. Am J Physiol Lung Cell Mol Physiol. 2023. PMID: 36410021 Free PMC article. Review. - Super-resolution fluorescence microscopy by stepwise optical saturation.
Zhang Y, Nallathamby PD, Vigil GD, Khan AA, Mason DE, Boerckel JD, Roeder RK, Howard SS. Zhang Y, et al. Biomed Opt Express. 2018 Mar 12;9(4):1613-1629. doi: 10.1364/BOE.9.001613. eCollection 2018 Apr 1. Biomed Opt Express. 2018. PMID: 29675306 Free PMC article. - Sense and Immunity: Context-Dependent Neuro-Immune Interplay.
Foster SL, Seehus CR, Woolf CJ, Talbot S. Foster SL, et al. Front Immunol. 2017 Nov 3;8:1463. doi: 10.3389/fimmu.2017.01463. eCollection 2017. Front Immunol. 2017. PMID: 29163530 Free PMC article. Review. - Neuropeptides control the dynamic behavior of airway mucosal dendritic cells.
Voedisch S, Rochlitzer S, Veres TZ, Spies E, Braun A. Voedisch S, et al. PLoS One. 2012;7(9):e45951. doi: 10.1371/journal.pone.0045951. Epub 2012 Sep 26. PLoS One. 2012. PMID: 23049899 Free PMC article. - Neuroimmune circuits in inter-organ communication.
Huh JR, Veiga-Fernandes H. Huh JR, et al. Nat Rev Immunol. 2020 Apr;20(4):217-228. doi: 10.1038/s41577-019-0247-z. Epub 2019 Dec 17. Nat Rev Immunol. 2020. PMID: 31848462 Review.
References
- Holt PG, Strickland DH, Wikstrom ME, Jahnsen FL. Regulation of immunological homeostasis in the respiratory tract. Nat Rev Immunol. 2008;8:142–152. - PubMed
- Widdicombe JG. Overview of neural pathways in allergy and asthma. Pulm Pharmacol Ther. 2003;16:23–30. - PubMed
- Jahnsen FL, Strickland DH, Thomas JA, Tobagus IT, Napoli S, Zosky GR, Turner DJ, Sly PD, Stumbles PA, Holt PG. Accelerated antigen sampling and transport by airway mucosal dendritic cells following inhalation of a bacterial stimulus. J Immunol. 2006;177:5861–5867. - PubMed
- Iwasaki A. Mucosal dendritic cells. Annu Rev Immunol. 2007;25:381–418. - PubMed
- Huh JC, Strickland DH, Jahnsen FL, Turner DJ, Thomas JA, Napoli S, Tobagus I, Stumbles PA, Sly PD, Holt PG. Bidirectional interactions between antigen-bearing respiratory tract dendritic cells (DCs) and T cells precede the late phase reaction in experimental asthma: dC activation occurs in the airway mucosa but not in the lung parenchyma. J Exp Med. 2003;198:19–30. - PMC - PubMed
Publication types
MeSH terms
Substances
LinkOut - more resources
Full Text Sources
Other Literature Sources
Medical
Miscellaneous


