Odor coding by modules of coherent mitral/tufted cells in the vertebrate olfactory bulb - PubMed (original) (raw)
Odor coding by modules of coherent mitral/tufted cells in the vertebrate olfactory bulb
Tsai-Wen Chen et al. Proc Natl Acad Sci U S A. 2009.
Abstract
Odor representation in the olfactory bulb (OB) undergoes a transformation from a combinatorial glomerular map to a distributed mitral/tufted (M/T) cell code. To understand this transformation, we analyzed the odor representation in large populations of individual M/T cells in the Xenopus OB. The spontaneous [Ca(2+)] activities of M/T cells appeared to be irregular, but there were groups of spatially distributed neurons showing synchronized [Ca(2+)] activities. These neurons were always connected to the same glomerulus. Odorants elicited complex spatiotemporal response patterns in M/T cells where nearby neurons generally showed little correlation. But the responses of neurons connected to the same glomerulus were virtually identical, irrespective of whether the responses were excitatory or inhibitory, and independent of the distance between them. Synchronous neurons received correlated EPSCs and were coupled by electrical conductances that could account for the correlated responses. Thus, at the output stage of the OB, odors are represented by modules of distributed and synchronous M/T cells associated with the same glomeruli. This allows for parallel input to higher brain centers.
Conflict of interest statement
The authors declare no conflict of interest.
Figures
Fig. 1.
Identification of connected M/T cells using cross-correlation analysis. (A) A fluorescence image of the M/T cell layer stained with calcium indicator Fura-2. (B) Spontaneous [Ca2+] signals of 50 simultaneously recorded cells. (C) A correlation matrix of calcium signals in the 50 neurons. Cells are rearranged according to the correlation values. Distinct regions of high correlation coefficients reveal groups of synchronous neurons. (D) [Ca2+] signals in 4 groups of synchronous neurons. (E) A pixel-based map of cross-correlation values calculated with respect to the activity of the neuron marked by an arrow. Two cells (arrowheads) were synchronous to the reference cell. (F) Cells belonging to different synchronous groups marked by different colors. (G) Histogram of the correlation values of 50,325 cell pairs. Inset, a peak in the high correlation range showing the presence of synchronous pairs. A similar peak does not exist in the negative correlation range (r<-0.5). (_H_) Histogram of the distances between synchronous cell pairs (_r_ > 0.6, n = 73 pairs). (I) Simultaneous on-cell recording of action potentials in a pair of synchronous neurons. (J) Expanded traces from regions marked in I. (K) Spike cross-correlogram showing the distribution of the lag (Δt) in spike time between the two cells. (L) Morphological reconstruction of a pair of synchronous neurons revealed their dendritic connections to the same glomerulus. (Scale bars, 20 μm.)
Fig. 2.
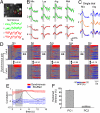
Synchronous M/T neurons show precisely matched excitatory/inhibitory odor responses. (A) Odor modulation of [Ca2+] signals in two pairs of synchronous M/T neurons. The first pair consistently responds with an increase in [Ca2+] (left) while the second pair responds to the same odor with a [Ca2+] decrease (right). Bottom traces: The response of a nearby, nonsynchronous neuron. (B) Odor-induced calcium responses color coded and shown for 18 pairs of synchronous M/T cells (left and middle panel). The responses of nonsynchronous neurons located next to one of the synchronous cells as a control (right panel). (C) The soma distances between the synchronous pairs and the nearby pairs in (B). (D) Integral responses in a poststimulus time window (marked under the panels in B) plotted for the synchronous cell pairs (left) and the nearby, nonsynchronous pairs (right). (E) The correlation coefficient of the response waveforms in synchronous pairs and nearby pairs (n = 18; *, P < 10−4).
Fig. 3.
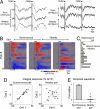
Two copies of odor codes in the Xenopus OB. (A) Two pairs of synchronous M/T cells (top) and their spontaneous [Ca2+] signals (bottom). Scale bar, 10 μm. (B) The responses of the four neurons to four different odorants (amino acid mixture, lysine, arginine and methionine, 50 μM). Color traces show average responses, gray traces show individual trials. (C) Single trial responses of a synchronous pair and their overlay. (D) Responses of 34 neurons to five odors (upper row). The same odors are similarly represented by the synchronous partners of these neurons (lower row). r, correlation coefficient. (E) The correlation coefficient (r) between the two ensembles measured in successive 250-ms windows plotted over time (red). Re-shuffling the cell order eliminates the correlation (blue). Error bars represents the SEM of r values over 12 trials (6 odors, each applied twice). Black trace shows the response waveform averaged over all neurons. (F) Percentage of response variance covered by the first (PC1) and the second principle component (PC2). Using a single variable (PC1) explains >90% of the variance of the responses of synchronous neurons.
Fig. 4.
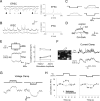
Mechanism of correlated activities in synchronous M/T cells. (A) Left, excitatory synaptic currents (EPSC) in a pair of synchronous neurons measured at −60 mV. Asterisks: synchronous events; arrows: asynchronous events. Right, membrane current cross-correlogram had a peak (r = 0.43) near Δt = 0. (B) Left, inhibitory synaptic currents (IPSC) in synchronous neurons measured at 0 mV. Most IPSC events are not synchronous. Right, cross-correlogram of the IPSCs do not show a significant peak. (C) Hyperpolarizing voltage steps (−60 to −85 mV) in one M/T cell elicit hyperpolarizing (outward) currents in its synchronous partner (left column) and vice versa (right column). The current traces are averages of 80 sweeps. (D) The coupling current is not affected by Cd2+ but it is abolished by subsequent application of gap junction inhibitor carbenoxolone (Carb). (E) Application of depolarizing or hyperpolarizing pulses to one neuron (upper) elicited nearly symmetrical coupling current responses in its synchronous partner (lower). Right: summary of coupling current responses in 4 pairs of synchronous neurons (6 coupling directions) (F) Simultaneous recording of membrane potential in a mitral cell (cell 1) during spontaneous [Ca2+] activity of its synchronous partner (cell 2). The voltage in cell 1 is locked to the [Ca2+] activity of cell 2. (G) Stimulating a patch-clamped neuron in depolarizing or hyperpoloarizing direction specifically enhances or suppresses the [Ca2+] activity of its synchronous partner. (H) Summary (mean ± SEM.) of the [Ca2+] activity modulation in synchronous (n = 4) and nonsynchronous (n = 7) pairs.
Similar articles
- Task-Demand-Dependent Neural Representation of Odor Information in the Olfactory Bulb and Posterior Piriform Cortex.
Wang D, Liu P, Mao X, Zhou Z, Cao T, Xu J, Sun C, Li A. Wang D, et al. J Neurosci. 2019 Dec 11;39(50):10002-10018. doi: 10.1523/JNEUROSCI.1234-19.2019. Epub 2019 Oct 31. J Neurosci. 2019. PMID: 31672791 Free PMC article. - Odor representation and coding by the mitral/tufted cells in the olfactory bulb.
Wang P, Li S, Li A. Wang P, et al. J Zhejiang Univ Sci B. 2024 Oct 15;25(10):824-840. doi: 10.1631/jzus.B2400051. J Zhejiang Univ Sci B. 2024. PMID: 39420520 Free PMC article. Review. - Functional transformations of odor inputs in the mouse olfactory bulb.
Adam Y, Livneh Y, Miyamichi K, Groysman M, Luo L, Mizrahi A. Adam Y, et al. Front Neural Circuits. 2014 Nov 4;8:129. doi: 10.3389/fncir.2014.00129. eCollection 2014. Front Neural Circuits. 2014. PMID: 25408637 Free PMC article. - Prenatal and Early Postnatal Odorant Exposure Heightens Odor-Evoked Mitral Cell Responses in the Mouse Olfactory Bulb.
Liu A, Urban NN. Liu A, et al. eNeuro. 2017 Sep 26;4(5):ENEURO.0129-17.2017. doi: 10.1523/ENEURO.0129-17.2017. eCollection 2017 Sep-Oct. eNeuro. 2017. PMID: 28955723 Free PMC article. - Olfactory maps and odor images.
Korsching S. Korsching S. Curr Opin Neurobiol. 2002 Aug;12(4):387-92. doi: 10.1016/s0959-4388(02)00348-3. Curr Opin Neurobiol. 2002. PMID: 12139985 Review.
Cited by
- Neural correlates of behavior in the moth Manduca sexta in response to complex odors.
Riffell JA, Lei H, Hildebrand JG. Riffell JA, et al. Proc Natl Acad Sci U S A. 2009 Nov 17;106(46):19219-26. doi: 10.1073/pnas.0910592106. Epub 2009 Nov 11. Proc Natl Acad Sci U S A. 2009. PMID: 19907000 Free PMC article. - Design principles of the sparse coding network and the role of "sister cells" in the olfactory system of Drosophila.
Zhang D, Li Y, Wu S, Rasch MJ. Zhang D, et al. Front Comput Neurosci. 2013 Oct 23;7:141. doi: 10.3389/fncom.2013.00141. eCollection 2013. Front Comput Neurosci. 2013. PMID: 24167488 Free PMC article. - Activity correlation imaging: visualizing function and structure of neuronal populations.
Junek S, Chen TW, Alevra M, Schild D. Junek S, et al. Biophys J. 2009 May 6;96(9):3801-9. doi: 10.1016/j.bpj.2008.12.3962. Biophys J. 2009. PMID: 19413986 Free PMC article. - Encoding odorant identity by spiking packets of rate-invariant neurons in awake mice.
Gschwend O, Beroud J, Carleton A. Gschwend O, et al. PLoS One. 2012;7(1):e30155. doi: 10.1371/journal.pone.0030155. Epub 2012 Jan 17. PLoS One. 2012. PMID: 22272291 Free PMC article. - Structure-activity relationships on the odor detectability of homologous carboxylic acids by humans.
Cometto-Muñiz JE, Abraham MH. Cometto-Muñiz JE, et al. Exp Brain Res. 2010 Nov;207(1-2):75-84. doi: 10.1007/s00221-010-2430-0. Epub 2010 Oct 8. Exp Brain Res. 2010. PMID: 20931179 Free PMC article.
References
- Mombaerts P, et al. Visualizing an olfactory sensory map. Cell. 1996;87:675–686. - PubMed
- Mori K, Nagao H, Yoshihara Y. The olfactory bulb: coding and processing of odor molecule information. Science. 1999;286:711–715. - PubMed
- Shepherd GM, Greer CA. In: Synaptic Organization of the Brain. Shepherd GM, editor. New York, NY: Oxford Univ. Press; 1998.
- Isaacson JS, Strowbridge BW. Olfactory reciprocal synapses: dendritic signaling in the CNS. Neuron. 1998;20:749–761. - PubMed
- Chen WR, Xiong W, Shepherd GM. Analysis of relations between NMDA receptors and GABA release at olfactory bulb reciprocal synapses. Neuron. 2000;25:625–633. - PubMed
Publication types
MeSH terms
Substances
LinkOut - more resources
Full Text Sources
Miscellaneous


