Complete but curtailed T-cell response to very low-affinity antigen - PubMed (original) (raw)
. 2009 Mar 12;458(7235):211-4.
doi: 10.1038/nature07657. Epub 2009 Jan 28.
Affiliations
- PMID: 19182777
- PMCID: PMC2735344
- DOI: 10.1038/nature07657
Complete but curtailed T-cell response to very low-affinity antigen
Dietmar Zehn et al. Nature. 2009.
Abstract
After an infection, T cells that carry the CD8 marker are activated and undergo a characteristic kinetic sequence of rapid expansion, subsequent contraction and formation of memory cells. The pool of naive T-cell clones is diverse and contains cells bearing T-cell antigen receptors (TCRs) that differ in their affinity for the same antigen. How these differences in affinity affect the function and the response kinetics of individual T-cell clones was previously unknown. Here we show that during the in vivo response to microbial infection, even very weak TCR-ligand interactions are sufficient to activate naive T cells, induce rapid initial proliferation and generate effector and memory cells. The strength of the TCR-ligand interaction critically affects when expansion stops, when the cells exit lymphoid organs and when contraction begins; that is, strongly stimulated T cells contract and exit lymphoid organs later than weakly stimulated cells. Our data challenge the prevailing view that strong TCR ligation is a prerequisite for CD8(+) T-cell activation. Instead, very weak interactions are sufficient for activation, but strong TCR ligation is required to sustain T-cell expansion. We propose that in response to microbial challenge, T-cell clones with a broad range of avidities for foreign ligands are initially recruited, and that the pool of T cells subsequently matures in affinity owing to the more prolonged expansion of high-affinity T-cell clones.
Figures
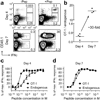
Fig. 1. Unequal propagation of OT-1 and endogenous CD8+ T cells
C57/BL6 mice were grafted with 3×10³ naïve CD45.1 OT-1 cells and infected with Listeria monocyogenes expressing Ova. On days 4 and 7 p.i., total splenocytes were harvested and briefly re-stimulated with Ova peptide in vitro. A, Representative CD8+ gated flow plots of splenocytes stimulated with or without 10 µM peptide are shown. Frequencies refer to total CD8+ cells. B, The ratios of the numbers of OT-1 and endogenous IFNγ+ T cells found in individual mice are graphically presented. C and D, Peptide dose-response curves normalized to the level of maximum numbers of IFNγ producing OT-1 and endogenous Kb/Ova-specific T cells are depicted (N=4 day 4, N=3 day 7), bars show standard error.
Fig. 2. The strength of TCR ligation dictates the timing of T cell contraction
Mice were grafted with 104 unlabeled (in A, C, D, E) or 2×10⁵ CFSE labeled naïve OT-1 cells (B) and infected with wildtype (wt) or recombinant Listeria monocytogenes expressing Ova protein containing native SIINFEKL (N4) or the indicated altered peptide ligands (APL), listed in order of decreasing potency (Supp. Fig. 2). A, The frequency of OT-1 among CD8+ cells in the blood at day 6 p.i., the insert shows Lm-V4 and wt Listeria on a magnified scale; B, CFSE dilution profiles of splenic OT-1 cells at day 3.25 p.i.; C, Numbers of splenic OT-1 cells at the indicated time points (N=4 per group and timepoint); D, Frequency of OT-1 among CD8+ blood cells at the indicated time points (N=5), bars show standard error; and E, Surface CCR7 and CD25 levels on splenic OT-1 at day 4 p.i.
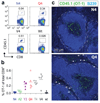
Fig. 3. The strength of TCR ligation determines migration kinetics
104 (A,B) and 3×10³ naïve OT-1 cells (C) were transferred into C57/BL6 mice, which were subsequently infected with Lm-N4ova or Lm-APLova strains. A, Representative flow plots of CD8+ gated white blood cells showing the frequency of OT-1 cells at 4 days p.i. B, shows data for all APL (N=5). C, Splenic sections taken at day 4 p.i. show the distribution of OT-1 cells stimulated by N4 or Q4. OT-1 cells are green and B cells are blue. The border of PALS and red pulp is marked and arrows indicate OT-1 cells within the red pulp.
Fig. 4. Low potency TCR ligands induce functional memory cells
Mice were grafted with congenic naïve OT-1 cells and infected with Lm-wt, Lm-N4ova or Lm-APLova strains. A, Representative flow plots of the frequencies of memory OT-1 among blood CD8+ T cells at day 138 p.i. B, the contraction and memory kinetics for all mice and all APL (N=5) until day 138 p.i. C, Mice were rechallenged on day 138 p.i. with VSV-N4ova and the frequencies of OT-1 among blood CD8+ T cells were determined 4 days later. The upper panels show representative flow plots and the lower depicts the data for all mice (N=5), with triangles indicating the frequency before and squares the frequency after the recall. Bars show standard error.
Similar articles
- CD40-activated B cells can efficiently prime antigen-specific naïve CD8+ T cells to generate effector but not memory T cells.
Mathieu M, Cotta-Grand N, Daudelin JF, Boulet S, Lapointe R, Labrecque N. Mathieu M, et al. PLoS One. 2012;7(1):e30139. doi: 10.1371/journal.pone.0030139. Epub 2012 Jan 23. PLoS One. 2012. PMID: 22291907 Free PMC article. - Increased apoptosis, curtailed expansion and incomplete differentiation of CD8+ T cells combine to decrease clearance of L. monocytogenes in old mice.
Smithey MJ, Renkema KR, Rudd BD, Nikolich-Žugich J. Smithey MJ, et al. Eur J Immunol. 2011 May;41(5):1352-64. doi: 10.1002/eji.201041141. Epub 2011 Apr 14. Eur J Immunol. 2011. PMID: 21469120 Free PMC article. - Listeria monocytogenes: a model pathogen to study antigen-specific memory CD8 T cell responses.
Khan SH, Badovinac VP. Khan SH, et al. Semin Immunopathol. 2015 May;37(3):301-10. doi: 10.1007/s00281-015-0477-5. Epub 2015 Apr 10. Semin Immunopathol. 2015. PMID: 25860798 Free PMC article. Review. - Processing of Listeria monocytogenes antigens and the in vivo T-cell response to bacterial infection.
Busch DH, Kerksiek K, Pamer EG. Busch DH, et al. Immunol Rev. 1999 Dec;172:163-9. doi: 10.1111/j.1600-065x.1999.tb01364.x. Immunol Rev. 1999. PMID: 10631945 Review.
Cited by
- Engineered TCR-T Cell Immunotherapy in Anticancer Precision Medicine: Pros and Cons.
Zhao Q, Jiang Y, Xiang S, Kaboli PJ, Shen J, Zhao Y, Wu X, Du F, Li M, Cho CH, Li J, Wen Q, Liu T, Yi T, Xiao Z. Zhao Q, et al. Front Immunol. 2021 Mar 30;12:658753. doi: 10.3389/fimmu.2021.658753. eCollection 2021. Front Immunol. 2021. PMID: 33859650 Free PMC article. Review. - Distinct CD4+ helper T cells involved in primary and secondary responses to infection.
Weber KS, Li QJ, Persaud SP, Campbell JD, Davis MM, Allen PM. Weber KS, et al. Proc Natl Acad Sci U S A. 2012 Jun 12;109(24):9511-6. doi: 10.1073/pnas.1202408109. Epub 2012 May 29. Proc Natl Acad Sci U S A. 2012. PMID: 22645349 Free PMC article. - TCR signaling requirements for activating T cells and for generating memory.
Zehn D, King C, Bevan MJ, Palmer E. Zehn D, et al. Cell Mol Life Sci. 2012 May;69(10):1565-75. doi: 10.1007/s00018-012-0965-x. Epub 2012 Apr 19. Cell Mol Life Sci. 2012. PMID: 22527712 Free PMC article. Review. - Microfluidics sorting enables the isolation of an intact cellular pair complex of CD8+ T cells and antigen-presenting cells in a cognate antigen recognition-dependent manner.
Kuwabara S, Tanimoto Y, Okutani M, Jie M, Haseda Y, Kinugasa-Katayama Y, Aoshi T. Kuwabara S, et al. PLoS One. 2021 Jun 14;16(6):e0252666. doi: 10.1371/journal.pone.0252666. eCollection 2021. PLoS One. 2021. PMID: 34125844 Free PMC article. - mir-181a-1/b-1 Modulates Tolerance through Opposing Activities in Selection and Peripheral T Cell Function.
Schaffert SA, Loh C, Wang S, Arnold CP, Axtell RC, Newell EW, Nolan G, Ansel KM, Davis MM, Steinman L, Chen CZ. Schaffert SA, et al. J Immunol. 2015 Aug 15;195(4):1470-9. doi: 10.4049/jimmunol.1401587. Epub 2015 Jul 10. J Immunol. 2015. PMID: 26163591 Free PMC article.
References
- Antia R, Ganusov VV, Ahmed R. The role of models in understanding CD8+ T-cell memory. Nat Rev Immunol. 2005;5(2):101–111. - PubMed
- Williams MA, Bevan MJ. Effector and memory CTL differentiation. Annu Rev Immunol. 2007;25:171–192. - PubMed
- Turner SJ, Doherty PC, McCluskey J, Rossjohn J. Structural determinants of T-cell receptor bias in immunity. Nat Rev Immunol. 2006;6(12):883–894. - PubMed
- Wilson DB, et al. Specificity and degeneracy of T cells. Mol Immunol. 2004;40(14–15):1047–1055. - PubMed
Publication types
MeSH terms
Substances
Grants and funding
- R01 AI019335/AI/NIAID NIH HHS/United States
- R01 AI019335-29/AI/NIAID NIH HHS/United States
- R01 AI019335-27/AI/NIAID NIH HHS/United States
- R01 AI019335-28/AI/NIAID NIH HHS/United States
- HHMI/Howard Hughes Medical Institute/United States
LinkOut - more resources
Full Text Sources
Other Literature Sources
Research Materials


