Solution hybrid selection with ultra-long oligonucleotides for massively parallel targeted sequencing - PubMed (original) (raw)
doi: 10.1038/nbt.1523. Epub 2009 Feb 1.
Alexandre Melnikov, Jared Maguire, Peter Rogov, Emily M LeProust, William Brockman, Timothy Fennell, Georgia Giannoukos, Sheila Fisher, Carsten Russ, Stacey Gabriel, David B Jaffe, Eric S Lander, Chad Nusbaum
Affiliations
- PMID: 19182786
- PMCID: PMC2663421
- DOI: 10.1038/nbt.1523
Solution hybrid selection with ultra-long oligonucleotides for massively parallel targeted sequencing
Andreas Gnirke et al. Nat Biotechnol. 2009 Feb.
Abstract
Targeting genomic loci by massively parallel sequencing requires new methods to enrich templates to be sequenced. We developed a capture method that uses biotinylated RNA 'baits' to fish targets out of a 'pond' of DNA fragments. The RNA is transcribed from PCR-amplified oligodeoxynucleotides originally synthesized on a microarray, generating sufficient bait for multiple captures at concentrations high enough to drive the hybridization. We tested this method with 170-mer baits that target >15,000 coding exons (2.5 Mb) and four regions (1.7 Mb total) using Illumina sequencing as read-out. About 90% of uniquely aligning bases fell on or near bait sequence; up to 50% lay on exons proper. The uniformity was such that approximately 60% of target bases in the exonic 'catch', and approximately 80% in the regional catch, had at least half the mean coverage. One lane of Illumina sequence was sufficient to call high-confidence genotypes for 89% of the targeted exon space.
Figures
Figure 1
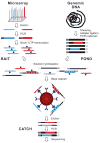
Overview of hybrid selection method. Illustrated are steps involved in the preparation of a complex pool of biotinylated RNA capture probes (“bait”; top left), whole-genome fragment input library (“pond”; top right) and hybrid-selected enriched output library (“catch”; bottom). Two sequencing targets and their respective baits are shown in red and blue. Thin and thick lines represent single and double strands, respectively. Universal adapter sequences are grey. The excess of single-stranded non-self-complementary RNA (wavy lines) drives the hybridization. See main text and Methods for details.
Figure 2
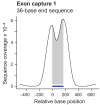
Coverage profiles of exon targets by end sequencing and shotgun sequencing. Shown are cumulative coverage profiles that sum the per-base sequencing coverage along 7,052 single-bait target exons. Only free-standing baits that were not within 500 bases of another one were included in this analysis. End sequencing of exon capture 1 with 36-base reads (a) produced a bimodal profile with high sequence coverage near and slightly beyond the ends of the 170-base baits (indicated by the horizontal bar). Shotgun sequencing of capture 2 from a different pond library (containing fragments with generic rather than Illumina-specific adapters) with 36-base reads after concatenating and re-shearing (b) gave more coverage on bait (shaded area) than near bait. Re-sequencing of capture 1 with 76-base end reads (c) had a similar effect, although the peak was slightly wider and the on-bait fraction of the peak area slightly less. Note that the scale on the Y-axis and hence the absolute peak height is different in each case. The different scales reflect the different numbers of sequenced bases which is much lower for GA-I lanes (a, b) than for a GA-II lane (c).
Figure 3
Sequence coverage along a contiguous target. Shown is base-by-base sequence coverage along a typical 11-kb segment (chr4:118635000-118646000) out of 1.7 Mb. Sequence corresponding to bait is marked in blue. Segments that had more than 40 repeat-masked bases per 170-base window were not targeted by baits and received little or no coverage with sequencing reads aligning uniquely to the genome except directly adjacent to a bait.
Figure 4
Normalized coverage-distribution plots. Shown is the fraction of bait-covered bases in the genome achieving coverage with uniquely aligned sequence equal or greater than the normalized coverage indicated on the X-axis. The absolute per base coverage was divided by the mean coverage of all bait positions (18 in a; 221 in b). The curve for the shotgun-sequenced exon capture (a) is steeper than the curve for the regional capture (b) indicating a less uniform representation of sequencing targets in the exon catch. Dashed lines point to the fraction of bases achieving at least half or one fifth the mean coverage.
Figure 5
Reproducibility of hybrid selection. For each exon (n = 15,565), the ratio of the mean coverage in two independent hybrid selection experiments performed on the same source DNA (NA15510) was plotted over its mean coverage in one experiment (a). Coverage was normalized to adjust for the different number of sequencing reads. The average ratio (black line) is close to 1. Standard deviations are indicated by purple lines. The graph on the right (b) shows base-by-base sequence coverage along one target in three independent hybrid selections, two of them performed on NA15510 (purple and teal lines) and one on NA11994 source DNA (black). Note the similiarities at this fine resolution of the three profiles which were normalized to the same height. The position of target exon (ENSE00000968562) and bait is indicated by red and blue bars, respectively.
Similar articles
- Hybrid selection of discrete genomic intervals on custom-designed microarrays for massively parallel sequencing.
Hodges E, Rooks M, Xuan Z, Bhattacharjee A, Benjamin Gordon D, Brizuela L, Richard McCombie W, Hannon GJ. Hodges E, et al. Nat Protoc. 2009;4(6):960-74. doi: 10.1038/nprot.2009.68. Epub 2009 May 28. Nat Protoc. 2009. PMID: 19478811 Free PMC article. - Systematic comparison of three genomic enrichment methods for massively parallel DNA sequencing.
Teer JK, Bonnycastle LL, Chines PS, Hansen NF, Aoyama N, Swift AJ, Abaan HO, Albert TJ; NISC Comparative Sequencing Program; Margulies EH, Green ED, Collins FS, Mullikin JC, Biesecker LG. Teer JK, et al. Genome Res. 2010 Oct;20(10):1420-31. doi: 10.1101/gr.106716.110. Epub 2010 Sep 1. Genome Res. 2010. PMID: 20810667 Free PMC article. - Comparison of solution-based exome capture methods for next generation sequencing.
Sulonen AM, Ellonen P, Almusa H, Lepistö M, Eldfors S, Hannula S, Miettinen T, Tyynismaa H, Salo P, Heckman C, Joensuu H, Raivio T, Suomalainen A, Saarela J. Sulonen AM, et al. Genome Biol. 2011 Sep 28;12(9):R94. doi: 10.1186/gb-2011-12-9-r94. Genome Biol. 2011. PMID: 21955854 Free PMC article. - Solution-based targeted genomic enrichment for precious DNA samples.
Shearer AE, Hildebrand MS, Smith RJ. Shearer AE, et al. BMC Biotechnol. 2012 May 4;12:20. doi: 10.1186/1472-6750-12-20. BMC Biotechnol. 2012. PMID: 22559009 Free PMC article. - Methods for genomic partitioning.
Turner EH, Ng SB, Nickerson DA, Shendure J. Turner EH, et al. Annu Rev Genomics Hum Genet. 2009;10:263-84. doi: 10.1146/annurev-genom-082908-150112. Annu Rev Genomics Hum Genet. 2009. PMID: 19630561 Review.
Cited by
- Distinct Escherichia coli transcriptional profiles in the guts of recurrent UTI sufferers revealed by pangenome hybrid selection.
Young MG, Straub TJ, Worby CJ, Metsky HC, Gnirke A, Bronson RA, van Dijk LR, Desjardins CA, Matranga C, Qu J, Villicana JB, Azimzadeh P, Kau A, Dodson KW, Schreiber HL 4th, Manson AL, Hultgren SJ, Earl AM. Young MG, et al. Nat Commun. 2024 Nov 2;15(1):9466. doi: 10.1038/s41467-024-53829-7. Nat Commun. 2024. PMID: 39487120 Free PMC article. - Probiotic neoantigen delivery vectors for precision cancer immunotherapy.
Redenti A, Im J, Redenti B, Li F, Rouanne M, Sheng Z, Sun W, Gurbatri CR, Huang S, Komaranchath M, Jang Y, Hahn J, Ballister ER, Vincent RL, Vardoshivilli A, Danino T, Arpaia N. Redenti A, et al. Nature. 2024 Oct 16. doi: 10.1038/s41586-024-08033-4. Online ahead of print. Nature. 2024. PMID: 39415001 - VenomCap: An exon-capture probe set for the targeted sequencing of snake venom genes.
Travers SL, Hutter CR, Austin CC, Donnellan SC, Buehler MD, Ellison CE, Ruane S. Travers SL, et al. Mol Ecol Resour. 2024 Nov;24(8):e14020. doi: 10.1111/1755-0998.14020. Epub 2024 Sep 19. Mol Ecol Resour. 2024. PMID: 39297212 - RNA exon editing: Splicing the way to treat human diseases.
Doi A, Delaney C, Tanner D, Burkhart K, Bell RD. Doi A, et al. Mol Ther Nucleic Acids. 2024 Aug 16;35(3):102311. doi: 10.1016/j.omtn.2024.102311. eCollection 2024 Sep 10. Mol Ther Nucleic Acids. 2024. PMID: 39281698 Free PMC article. Review.
References
- Shendure J, et al. Accurate multiplex polony sequencing of an evolved bacterial genome. Science. 2005;309:1728–1732. - PubMed
Publication types
MeSH terms
Substances
LinkOut - more resources
Full Text Sources
Other Literature Sources
Research Materials
Miscellaneous


