Two-dimensional infrared spectroscopy provides evidence of an intermediate in the membrane-catalyzed assembly of diabetic amyloid - PubMed (original) (raw)
Two-dimensional infrared spectroscopy provides evidence of an intermediate in the membrane-catalyzed assembly of diabetic amyloid
Yun L Ling et al. J Phys Chem B. 2009.
Abstract
Islet amyloid polypeptide (IAPP, also known as amylin) is responsible for pancreatic amyloid deposits in type 2 diabetes. The deposits, as well as intermediates in their assembly, are cytotoxic to pancreatic beta-cells and contribute to the loss of beta-cell mass associated with type 2 diabetes. The factors that trigger islet amyloid deposition in vivo are not well understood, but peptide membrane interactions have been postulated to play an important role in islet amyloid formation. To better understand the role of membrane interactions in amyloid formation, two-dimensional infrared (2D IR) spectroscopy was used to compare the kinetics of amyloid formation for human IAPP both in the presence and in the absence of negatively charged lipid vesicles. Comparison of spectral features and kinetic traces from the two sets of experiments provides evidence for the formation of an ordered intermediate during the membrane-mediated assembly of IAPP amyloid. A characteristic transient spectral feature is detected during amyloid formation in the presence of vesicles that is not observed in the absence of vesicles. The spectral feature associated with the intermediate raises in intensity during the self-assembly process and subsequently decays in intensity in the classic manner of a kinetic intermediate. Studies with rat IAPP, a variant that is known to interact with membranes but does not form amyloid, confirm the presence of an intermediate. The analysis of 2D IR spectra in terms of specific structural features is discussed. The unique combination of time and secondary structure resolution of 2D IR spectroscopy has enabled the time-evolution of a hIAPP intermediate to be directly monitored for the first time. The data presented here demonstrates the utility of 2D IR spectroscopy for studying membrane-catalyzed amyloid formation.
Figures
Figure 1
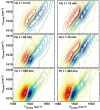
(a-c) Representative 2D IR spectra at folding time t = 5 minutes, 60 minutes and 650 minutes during uncatalyzed aggregation and (d-f) three spectra at folding times t = 15, 35 and 305 minutes during lipid vesicle (7: 3 DOPC/DOPA) catalyzed aggregation. Lipid vesicles were added at t = 14 min. Red contours are positive and correspond to the same intensity interval in all spectra.
Figure 2
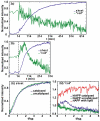
Intensities in anti-symmetric β-sheet and “random coil” regions versus aggregation time for (a) uncatalyzed and (b) membrane-catalyzed hIAPP folding. The dashed line indicates at t=14 minutes lipid vesicles were added. Intensities are normalized to minimum and maximum of individual kinetic traces. (c) Normalized intensities of anti-symmetric β-sheet feature for uncatalyzed (green) and catalyzed (blue). (d) Intensities in “random coil” region (1642 cm-1), for the (green) uncatalyzed, (blue) catalyzed hIAPP experiment and (red) rIAPP experiment. Intensities are normalized to starting values at t= 0.
Figure 3
Diagonal slices along (a) fundamental peaks and (b) overtone peaks for uncatalyzed aggregation. Diagonal slices along (a) fundamental and (b) overtone peaks for catalyzed aggregation.
Figure 4
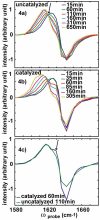
Slices along ωprobe for ωpump = 1642 cm-1 in the (a) uncatalyzed and (b) catalyzed spectra. (c) Comparison of slices at ωpump = 1642 cm-1 at t = t50 during uncatalyzed (green) and catalyzed (blue) aggregations.
Figure 5
Kinetics and fits for lipid vesicle catalyzed aggregation, (a) β-sheet and (b) ‘random coil ’. (c) β-sheet kinetics and fit for aggregation without catalyzation.
Figure 6
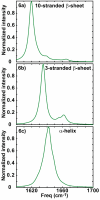
(a) Linear absorption spectrum calculated for a β-sheet of 10 strands, each composed of 10 residues. (b) Simulated absorption spectrum of 3 stranded β-sheet with each strand consisting 10 residues. (c) Infrared spectrum predicted for α-helix with 14 residues.
Similar articles
- Impact of Ca2+ on membrane catalyzed IAPP amyloid formation and IAPP induced vesicle leakage.
Li MH, Zhang X, London E, Raleigh DP. Li MH, et al. Biochim Biophys Acta Biomembr. 2023 Aug;1865(6):184161. doi: 10.1016/j.bbamem.2023.184161. Epub 2023 Apr 28. Biochim Biophys Acta Biomembr. 2023. PMID: 37121365 Free PMC article. - Three-dimensional structure and orientation of rat islet amyloid polypeptide protein in a membrane environment by solution NMR spectroscopy.
Nanga RP, Brender JR, Xu J, Hartman K, Subramanian V, Ramamoorthy A. Nanga RP, et al. J Am Chem Soc. 2009 Jun 17;131(23):8252-61. doi: 10.1021/ja9010095. J Am Chem Soc. 2009. PMID: 19456151 Free PMC article. - Membrane disordering is not sufficient for membrane permeabilization by islet amyloid polypeptide: studies of IAPP(20-29) fragments.
Brender JR, Heyl DL, Samisetti S, Kotler SA, Osborne JM, Pesaru RR, Ramamoorthy A. Brender JR, et al. Phys Chem Chem Phys. 2013 Jun 21;15(23):8908-15. doi: 10.1039/c3cp44696d. Epub 2013 Mar 15. Phys Chem Chem Phys. 2013. PMID: 23493863 Free PMC article. - Islet amyloid and type 2 diabetes: from molecular misfolding to islet pathophysiology.
Jaikaran ET, Clark A. Jaikaran ET, et al. Biochim Biophys Acta. 2001 Nov 29;1537(3):179-203. doi: 10.1016/s0925-4439(01)00078-3. Biochim Biophys Acta. 2001. PMID: 11731221 Review. - Causative factors for formation of toxic islet amyloid polypeptide oligomer in type 2 diabetes mellitus.
Jeong HR, An SS. Jeong HR, et al. Clin Interv Aging. 2015 Nov 19;10:1873-9. doi: 10.2147/CIA.S95297. eCollection 2015. Clin Interv Aging. 2015. PMID: 26604727 Free PMC article. Review.
Cited by
- Structural Dissection of the First Events Following Membrane Binding of the Islet Amyloid Polypeptide.
Khemtemourian L, Fatafta H, Davion B, Lecomte S, Castano S, Strodel B. Khemtemourian L, et al. Front Mol Biosci. 2022 Mar 15;9:849979. doi: 10.3389/fmolb.2022.849979. eCollection 2022. Front Mol Biosci. 2022. PMID: 35372496 Free PMC article. - Development and validation of transferable amide I vibrational frequency maps for peptides.
Wang L, Middleton CT, Zanni MT, Skinner JL. Wang L, et al. J Phys Chem B. 2011 Apr 7;115(13):3713-24. doi: 10.1021/jp200745r. Epub 2011 Mar 15. J Phys Chem B. 2011. PMID: 21405034 Free PMC article. - Metastable intermediate during hIAPP aggregation catalyzed by membranes as detected with 2D IR spectroscopy.
Dicke SS, Maj M, Fields CR, Zanni MT. Dicke SS, et al. RSC Chem Biol. 2022 Jun 13;3(7):931-940. doi: 10.1039/d2cb00028h. eCollection 2022 Jul 6. RSC Chem Biol. 2022. PMID: 35866164 Free PMC article. - A Free Energy Barrier Caused by the Refolding of an Oligomeric Intermediate Controls the Lag Time of Amyloid Formation by hIAPP.
Serrano AL, Lomont JP, Tu LH, Raleigh DP, Zanni MT. Serrano AL, et al. J Am Chem Soc. 2017 Nov 22;139(46):16748-16758. doi: 10.1021/jacs.7b08830. Epub 2017 Nov 7. J Am Chem Soc. 2017. PMID: 29072444 Free PMC article. - Strategies for extracting structural information from 2D IR spectroscopy of amyloid: application to islet amyloid polypeptide.
Strasfeld DB, Ling YL, Gupta R, Raleigh DP, Zanni MT. Strasfeld DB, et al. J Phys Chem B. 2009 Nov 26;113(47):15679-91. doi: 10.1021/jp9072203. J Phys Chem B. 2009. PMID: 19883093 Free PMC article.
References
- Sunde M, Blake C. The structure of amyloid fibrils by electron microscopy and X-ray diffraction. Adv. Protein. Chem. 1997;50:123–159. - PubMed
- Tycko R. Progress towards a molecular-level structural understanding of amyloid fibrils. Curr. Opin. Struc. Biol. 2004;14:96–103. - PubMed
- Mclean LR, Balasubramanism A. Promotion of beta-structure by interaction of diabetes associated polypeptide (amylin) with phosphatidylcholine. Biochim. Biophys. Acta. 1992;1122:317–320. - PubMed
- Griffiths JM, Ashburn TT, Auger M, Costa PR, Griffin RG, Lansbury PT. Rotational resonance solid-state NMR elucidates a structural model of pancreatic amyloid. J. Am. Chem. Soc. 1995;117:3539–3546.
- Makin OS, Serpell LC. Structural characterization of islet amyloid polypeptide fibrils. J. Mol. Biol. 2004;355:1279–1288. - PubMed
Publication types
MeSH terms
Substances
Grants and funding
- R01 GM078114-01A2/GM/NIGMS NIH HHS/United States
- DK79895/DK/NIDDK NIH HHS/United States
- R01 GM078114/GM/NIGMS NIH HHS/United States
- GM078114/GM/NIGMS NIH HHS/United States
- R01 DK079895-01/DK/NIDDK NIH HHS/United States
- R01 DK079895/DK/NIDDK NIH HHS/United States
LinkOut - more resources
Full Text Sources


