Down-regulation of Gfi-1 expression by TGF-beta is important for differentiation of Th17 and CD103+ inducible regulatory T cells - PubMed (original) (raw)
Down-regulation of Gfi-1 expression by TGF-beta is important for differentiation of Th17 and CD103+ inducible regulatory T cells
Jinfang Zhu et al. J Exp Med. 2009.
Abstract
Growth factor independent 1 (Gfi-1), a transcriptional repressor, is transiently induced during T cell activation. Interleukin (IL) 4 further induces Gfi-1, resulting in optimal Th2 cell expansion. We report a second important function of Gfi-1 in CD4 T cells: prevention of alternative differentiation by Th2 cells, and inhibition of differentiation of naive CD4 T cells to either Th17 or inducible regulatory T (iTreg) cells. In Gfi1(-/-) Th2 cells, the Rorc, Il23r, and Cd103 loci showed histone 3 lysine 4 trimethylation modifications that were lacking in wild-type Th2 cells, implying that Gfi-1 is critical for epigenetic regulation of Th17 and iTreg cell-related genes in Th2 cells. Enforced Gfi-1 expression inhibited IL-17 production and iTreg cell differentiation. Furthermore, a key inducer of both Th17 and iTreg cell differentiation, transforming growth factor beta, repressed Gfi-1 expression, implying a reciprocal negative regulation of CD4 T cell fate determination. Chromatin immunoprecipitation showed direct binding of the Gfi-1-lysine-specific demethylase 1 repressive complex to the intergenic region of Il17a/Il17f loci and to intron 1 of Cd103. T cell-specific Gfi1 conditional knockout mice displayed a striking delay in the onset of experimental allergic encephalitis correlated with a dramatic increase of Foxp3(+)CD103(+) CD4 T cells. Thus, Gfi-1 plays a critical role both in enhancing Th2 cell expansion and in repressing induction of Th17 and CD103(+) iTreg cells.
Figures
Figure 1.
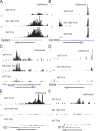
Abnormal histone H3K4 trimethylation at the Cd103, Rorc, and Il23r loci in Gfi1 cKO Th2 cells. CD4+ T cells from naive wild-type or Gfi1 cKO mice were activated under Th2 or Th17 conditions for 4 d. Cells were harvested and fixed. ChIP-Seq analysis was performed using a specific antibody against H3K4 trimethylation (H3K4me3). The sequence tags mapped to the locus of (A) Gata3, (B) Cd103, (C) Rorc, (D) Il23r, (E) Il21, and (F) Il17f are shown. The total tag numbers mapped to the genome are 2, 6, and 7.1 million for WT-Th17, Gfi1 cKO–Th2, and WT-Th2, respectively. The scale for the WT-Th17 sample was adjusted separately because of approximately threefold fewer total tag numbers.
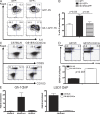
Figure 2.
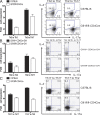
Endogenous Gfi-1 induced by IL-4 suppresses IL-17 production. (A and B) CD4+ T cells from naive mice were activated under Th2 conditions for 4 d. After 2 d, cultured in complete RPMI 1640 with IL-2, cells were either (A) unsorted or (B) sorted for GFP+ (IL-4–producing) cells and were further stimulated under Th2 or Th17 conditions for another 4 d. (C) CD4+ T cells were first activated under Th17 conditions before they were stimulated under Th2 or Th17 conditions for the second round. Cells were counted before and after the second round of stimulation. Fold cell expansion was calculated. Cytokine production was assessed by intracellular staining after PMA plus ionomycin stimulation. Numbers indicate the percentage of cells in each quadrant or gate. Error bars represent means ± SD, and data are representative of two independent experiments.
Figure 3.
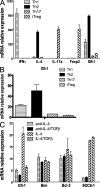
Gfi-1 expression is down-regulated by TGF-β. CD4+ T cells from naive mice were activated under Th1, Th2, Th17, or iTreg conditions for (A) 4 d or (B) 24 h, or (C) under ThN (nonpolarization) conditions for 24 h followed by cytokine stimulation for 2 h. Cells were harvested and total RNAs were isolated. The relative expression levels of different genes normalized to GAPDH were assessed by real-time PCR after reverse transcription. Error bars represent means ± SD, and data are representative of two independent experiments.
Figure 4.
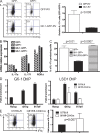
Gfi-1 binds to the Il17a/Il17f intergenic region and inhibits IL-17a and IL-17f expression. CD4+ T cells from naive mice were activated under neutral conditions for 24 h and infected with (A–C) GFP-RV, (A–C) Gfi-1–GFP-RV, (C) or Gfi-1(P2A)–GFP-RV. (A and C) Infected cells were further primed under Th17 conditions for 4 d. Cytokine production was assessed by intracellular staining after PMA plus ionomycin stimulation. (A) Numbers indicate the percentage of cells in each quadrant (left). Relative IL-17–producing cells (GFP+/GFP−) pooled from three independent experiments are shown (right). (B) GFP+ and GFP− cells were sorted 24 h after infection. Sorted cells were maintained under Th17 conditions for another 2 d. Cells were harvested and total RNAs were isolated. The expression levels of different genes normalized to GAPDH were assessed by real-time PCR after RT. (C) The percentage of IL-17–producing cells from each GFP+ group was plotted. (D) Gfi-1–GFP-RV–infected Th17 cells were used for Gfi-1 ChIP (left). Wild-type and Gfi1 cKO Th2 cells were used for LSD1 ChIP (right). The enrichment of individual sites was normalized to a negative control from _Gata3_-intron3. (E) CD4 T cells from naive wild-type or Gfi1 cKO mice were primed under Th17 conditions for 4 d. Cytokine production was assessed by intracellular staining after PMA plus ionomycin stimulation. Numbers indicate the percentage of cells in each quadrant (left). Data from nine independent experiments are shown (right). Error bars represent means ± SD.
Figure 5.
Gfi-1 limits the differentiation of iTreg cells and regulates the CD103+Foxp3+ subset. (A and B) CD25-depleted CD4+ T cells were activated under neutral conditions for 24 h, infected with RV, and further primed under iTreg cell conditions for 4 d. Cells were restimulated with PMA plus ionomycin for 4 h in the presence of monensin during last 2 h. Cytokine production and Foxp3 expression was assessed by intracellular staining. (C) CD25-depleted CD4+ T cells were activated under iTreg cell conditions for 4 d. Cell-surface markers were costained with Foxp3. Dot plots were gated on CD4+ cells. (D) Lymph node cells were stained directly with CD4, Foxp3, and CD103. Dot plots were gated on CD4+ cells. Numbers indicate the percentage of cells in each quadrant (top). Within the CD4+Foxp3+ population, the percentage of CD103+ cells was calculated from the data obtained from four mice per group (bottom). (E) Wild-type CD4 T cells that had been primed under Th2 conditions for 4 d were used for Gfi-1 ChIP (left), and both wild-type Th2 and Gfi1 cKO Th2 cells were used for LSD1 ChIP (right). Enrichment of individual sites from the Cd103 locus was normalized to a negative control from _Gata3_-intron3. Error bars in B, D, and E represent means ± SD.
Figure 6.
Delayed onset of EAE induction in Gfi1 cKO mice is correlated with the increased Foxp3+CD103+ population. (A, left) The time course of the disease induction in wild-type and Gfi1 cKO mice after MOG immunization. (right) The dates of disease onset after immunization in an individual mouse, pooled from three independent experiments, are shown. (B) Splenocytes were harvested at various times after immunization as indicated. CD4 T cells were purified and RNAs were made without in vitro stimulation. The expression of IFN-γ, IL-4, IL-17a, and CD103 relative to CD4 was assessed by real-time PCR. Error bars in A and B represent means ± SD. (C) Splenocytes were harvested at day 7 after immunization. Cells were stimulated with platebound anti-CD3/anti-CD28 for 6 h with the presence of monensin during the last 2 h before intracellular staining. The dot plots were gated on the CD4+CD44hi population. (D) Splenocytes harvested from mice 3 wk after immunization were directly stained for CD4, CD103, and Foxp3. The dot plots were gated on CD4+ splenocytes. Numbers indicate the percentage of cells in each quadrant. Data are representative of at least two independent experiments.
Similar articles
- Smad2 and Smad3 are redundantly essential for the TGF-beta-mediated regulation of regulatory T plasticity and Th1 development.
Takimoto T, Wakabayashi Y, Sekiya T, Inoue N, Morita R, Ichiyama K, Takahashi R, Asakawa M, Muto G, Mori T, Hasegawa E, Saika S, Hara T, Nomura M, Yoshimura A. Takimoto T, et al. J Immunol. 2010 Jul 15;185(2):842-55. doi: 10.4049/jimmunol.0904100. Epub 2010 Jun 14. J Immunol. 2010. PMID: 20548029 - Preferential expression of integrin αvβ8 promotes generation of regulatory T cells by mouse CD103+ dendritic cells.
Païdassi H, Acharya M, Zhang A, Mukhopadhyay S, Kwon M, Chow C, Stuart LM, Savill J, Lacy-Hulbert A. Païdassi H, et al. Gastroenterology. 2011 Nov;141(5):1813-20. doi: 10.1053/j.gastro.2011.06.076. Epub 2011 Jul 13. Gastroenterology. 2011. PMID: 21745448 Free PMC article. - Dichotomous role of TGF-β controls inducible regulatory T-cell fate in allergic airway disease through Smad3 and TGF-β-activated kinase 1.
Joetham A, Schedel M, Ning F, Wang M, Takeda K, Gelfand EW. Joetham A, et al. J Allergy Clin Immunol. 2020 Mar;145(3):933-946.e4. doi: 10.1016/j.jaci.2019.09.032. Epub 2019 Oct 15. J Allergy Clin Immunol. 2020. PMID: 31626843 Free PMC article. - IL-17 and Th17 Cells.
Korn T, Bettelli E, Oukka M, Kuchroo VK. Korn T, et al. Annu Rev Immunol. 2009;27:485-517. doi: 10.1146/annurev.immunol.021908.132710. Annu Rev Immunol. 2009. PMID: 19132915 Review.
Cited by
- Epigenetic Regulations of AhR in the Aspect of Immunomodulation.
Wajda A, Łapczuk-Romańska J, Paradowska-Gorycka A. Wajda A, et al. Int J Mol Sci. 2020 Sep 3;21(17):6404. doi: 10.3390/ijms21176404. Int J Mol Sci. 2020. PMID: 32899152 Free PMC article. Review. - Immunogenic dying cells elicit potent anti-tumor T cell immunity against lung metastasis and tumorigenesis.
Hu M, Meng X, Wang T, Wang Y, Chen X, Xu D, He W, Zhang H, Guo W, Jing B, Zhang S, Xu J, Sun B, Sun X, Liu T, Ni N, Zhang T, Cui W, Wu X, Xia L, Yao F, Zhang F, Du J, Deng J. Hu M, et al. J Cancer Res Clin Oncol. 2025 Jan 18;151(1):38. doi: 10.1007/s00432-025-06087-z. J Cancer Res Clin Oncol. 2025. PMID: 39825073 Free PMC article. - Neutrophils in a mouse model of autoantibody-mediated arthritis: critical producers of Fc receptor gamma, the receptor for C5a, and lymphocyte function-associated antigen 1.
Monach PA, Nigrovic PA, Chen M, Hock H, Lee DM, Benoist C, Mathis D. Monach PA, et al. Arthritis Rheum. 2010 Mar;62(3):753-64. doi: 10.1002/art.27238. Arthritis Rheum. 2010. PMID: 20191628 Free PMC article. - IRF4 and its regulators: evolving insights into the pathogenesis of inflammatory arthritis?
Biswas PS, Bhagat G, Pernis AB. Biswas PS, et al. Immunol Rev. 2010 Jan;233(1):79-96. doi: 10.1111/j.0105-2896.2009.00864.x. Immunol Rev. 2010. PMID: 20192994 Free PMC article. Review. - Inducers, Attractors and Modulators of CD4+ Treg Cells in Non-Small-Cell Lung Cancer.
Xie M, Wei J, Xu J. Xie M, et al. Front Immunol. 2020 Apr 28;11:676. doi: 10.3389/fimmu.2020.00676. eCollection 2020. Front Immunol. 2020. PMID: 32425930 Free PMC article. Review.
References
- Murphy K.M., Reiner S.L. 2002. The lineage decisions of helper T cells.Nat. Rev. Immunol. 2:933–944 - PubMed
- Paul W.E., Seder R.A. 1994. Lymphocyte responses and cytokines.Cell. 76:241–251 - PubMed
- Weaver C.T., Hatton R.D., Mangan P.R., Harrington L.E. 2007. IL-17 family cytokines and the expanding diversity of effector T cell lineages.Annu. Rev. Immunol. 25:821–852 - PubMed
Publication types
MeSH terms
Substances
LinkOut - more resources
Full Text Sources
Other Literature Sources
Molecular Biology Databases
Research Materials
