Protection of synapses against Alzheimer's-linked toxins: insulin signaling prevents the pathogenic binding of Abeta oligomers - PubMed (original) (raw)
Protection of synapses against Alzheimer's-linked toxins: insulin signaling prevents the pathogenic binding of Abeta oligomers
Fernanda G De Felice et al. Proc Natl Acad Sci U S A. 2009.
Erratum in
- Proc Natl Acad Sci U S A. 2009 May 5;106(18):7678
Abstract
Synapse deterioration underlying severe memory loss in early Alzheimer's disease (AD) is thought to be caused by soluble amyloid beta (Abeta) oligomers. Mechanistically, soluble Abeta oligomers, also referred to as Abeta-derived diffusible ligands (ADDLs), act as highly specific pathogenic ligands, binding to sites localized at particular synapses. This binding triggers oxidative stress, loss of synaptic spines, and ectopic redistribution of receptors critical to plasticity and memory. We report here the existence of a protective mechanism that naturally shields synapses against ADDL-induced deterioration. Synapse pathology was investigated in mature cultures of hippocampal neurons. Before spine loss, ADDLs caused major downregulation of plasma membrane insulin receptors (IRs), via a mechanism sensitive to calcium calmodulin-dependent kinase II (CaMKII) and casein kinase II (CK2) inhibition. Most significantly, this loss of surface IRs, and ADDL-induced oxidative stress and synaptic spine deterioration, could be completely prevented by insulin. At submaximal insulin doses, protection was potentiated by rosiglitazone, an insulin-sensitizing drug used to treat type 2 diabetes. The mechanism of insulin protection entailed a marked reduction in pathogenic ADDL binding. Surprisingly, insulin failed to block ADDL binding when IR tyrosine kinase activity was inhibited; in fact, a significant increase in binding was caused by IR inhibition. The protective role of insulin thus derives from IR signaling-dependent downregulation of ADDL binding sites rather than ligand competition. The finding that synapse vulnerability to ADDLs can be mitigated by insulin suggests that bolstering brain insulin signaling, which can decline with aging and diabetes, could have significant potential to slow or deter AD pathogenesis.
Conflict of interest statement
The authors declare no conflict of interest.
Figures
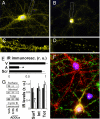
Fig. 1.
ADDLs induce the removal of IRs from dendritic plasma membranes. Cultured hippocampal neurons were exposed to 100 nM ADDLs at 37 °C for 3 h followed by immunolabeling with anti-IRα (yellow). Nuclear staining (DAPI) is shown in blue. A and B show representative images from vehicle- and ADDL-treated cultures, respectively. C and D show high-magnification images of dendrites contained in the dotted rectangles indicated in A and B, respectively. (E) Quantification of IR immunofluorescence levels (see SI Methods) for cultures treated with vehicle (V), ADDLs (A), or scrambled Aβ peptide (Scr). (F) A representative image showing double labeling for ADDL binding (NU4 oligomer antibody; green) and IRα (red). (G) Surface abundance of IRs in hippocampal neurons exposed to vehicle or 100 nM ADDLs for 0.5 or 3 h, assessed by surface biotinylation (see SI Methods). Asterisk indicates statistically significant (*, P < 0.0002) decrease compared to vehicle-treated cultures.
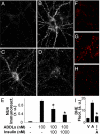
Fig. 2.
CK2 and CaMKII mediate ADDL-induced loss of insulin and NMDA receptors. (A–D) Representative high magnification images of IRα labeling in dendrites from hippocampal neurons treated for 3 h with vehicle (A), 100 nM ADDLs (B), 100 nM ADDLs + 5 μM KN93 (C), or 100 nM ADDLs + 10 μM DMAT (D). (E) Quantification of IR (black bars) and NMDAR (white bars) immunofluorescence. Bars correspond to integrated immunofluorescence intensities (see SI Methods) from 3 experiments using independent cultures (30 images analyzed per experimental condition per culture). Asterisks indicate statistically significant (*, P < 0.05; **, P < 0.001) increases compared to ADDL-treated cultures.
Fig. 3.
Insulin prevents ADDL-induced pathological trafficking of IRs. (A–D) Representative IR immunofluorescence images from hippocampal neurons treated with vehicle (A), 100 nM ADDLs (B), 100 nM ADDLs + 100 nM insulin (C), and 100 nM ADDLs + 1 μM insulin (D). (E) Integrated IR immunofluorescence from 6 experiments using independent cultures (30 images analyzed per experimental condition per culture). Asterisk indicates statistically significant (*, P < 0.005) increase compared to ADDL-treated cultures. (F–K) Neurons treated for 3 h with 100 nM ADDLs alone (F–H) or with 100 nM ADDLs + 100 nM insulin + 10 μM rosiglitazone (I–K) followed by double labeling for IR (red) and ADDLs (green). (H and K) Merged images of IR and ADDL immunolabeling. Note the inverse correlation between ADDL binding and dendritic IRα immunoreactivities on dendritic process.
Fig. 4.
Insulin blocks neuronal ADDL binding and ADDL-induced oxidative stress. (A–D) Representative images from hippocampal neurons treated with vehicle (A), 100 nM ADDLs (B), 100 nM ADDLs + 100 nM insulin (C), and 100 nM ADDLs + 1 μM insulin (D). ADDL binding was detected using NU4 antibody. (E) Integrated ADDL immunofluorescence intensities from 6 experiments using independent cultures (25 images analyzed per experimental condition per culture). Asterisk indicates statistically significant (*, P < 0.01) decrease compared to ADDL-treated cultures. (F–H) Representative DHE fluorescence images in hippocampal cultures treated with vehicle (F), 1 μM ADDLs (G), or 1 μM insulin + 1 μM ADDLs (H). (I) Integrated DHE fluorescence. Asterisk indicates statistically significant (*, P < 0.007) differences relative to ADDL-treated cultures.
Fig. 5.
Insulin blocks ADDL-induced synapse loss. (A–C) Representative images from hippocampal neurons treated with vehicle (A), 100 nM ADDLs (B), or 100 nM ADDLs + 1 μM insulin (C) for 24 h. Spines were labeled using phalloidin (green). (D–F) Double-labeling high-magnification images of dendrites from neurons treated with vehicle (D), ADDLs (E), or ADDLs + insulin (F). Spines were labeled by phalloidin (green) and ADDLs were detected using the NU4 antibody (red). (G) Quantification of spine number per unit dendrite length. Asterisk indicates statistically significant difference (*, P < 0.001) relative to vehicle-treated neurons.
Fig. 6.
Protection by insulin requires IR tyrosine kinase activity. (A–C) Representative images from hippocampal neurons treated with 100 nM ADDLs (A), 100 nM ADDLs + 1 μM insulin (B), or 100 nM ADDLs + 1 μM insulin + 5 μM AG1024 (C). ADDL binding was detected using the NU4 anti-ADDL antibody. (D) Integrated ADDL immunofluorescence from 3 experiments using independent neuronal cultures (25 images analyzed per experimental condition per culture). Pound sign indicates statistically significant (#, P < 0.001) difference relative to ADDL-treated cultures. Asterisk indicates statistically significant (*, P < 0.007) differences relative to cultures treated with ADDLs + insulin.
Comment in
- Insulin signaling in sporadic Alzheimer's disease.
Liao FF, Xu H. Liao FF, et al. Sci Signal. 2009 Jun 9;2(74):pe36. doi: 10.1126/scisignal.274pe36. Sci Signal. 2009. PMID: 19509405 Free PMC article.
Similar articles
- Why Alzheimer's is a disease of memory: the attack on synapses by A beta oligomers (ADDLs).
Viola KL, Velasco PT, Klein WL. Viola KL, et al. J Nutr Health Aging. 2008 Jan;12(1):51S-7S. doi: 10.1007/BF02982587. J Nutr Health Aging. 2008. PMID: 18165846 Review. - Blocking the Interaction between EphB2 and ADDLs by a Small Peptide Rescues Impaired Synaptic Plasticity and Memory Deficits in a Mouse Model of Alzheimer's Disease.
Shi XD, Sun K, Hu R, Liu XY, Hu QM, Sun XY, Yao B, Sun N, Hao JR, Wei P, Han Y, Gao C. Shi XD, et al. J Neurosci. 2016 Nov 23;36(47):11959-11973. doi: 10.1523/JNEUROSCI.1327-16.2016. J Neurosci. 2016. PMID: 27881781 Free PMC article. - Abeta oligomer-induced aberrations in synapse composition, shape, and density provide a molecular basis for loss of connectivity in Alzheimer's disease.
Lacor PN, Buniel MC, Furlow PW, Clemente AS, Velasco PT, Wood M, Viola KL, Klein WL. Lacor PN, et al. J Neurosci. 2007 Jan 24;27(4):796-807. doi: 10.1523/JNEUROSCI.3501-06.2007. J Neurosci. 2007. PMID: 17251419 Free PMC article. - Rosiglitazone prevents amyloid-β oligomer-induced impairment of synapse formation and plasticity via increasing dendrite and spine mitochondrial number.
Xu S, Liu G, Bao X, Wu J, Li S, Zheng B, Anwyl R, Wang Q. Xu S, et al. J Alzheimers Dis. 2014;39(2):239-51. doi: 10.3233/JAD-130680. J Alzheimers Dis. 2014. PMID: 24150104 - Drebrin in Alzheimer's Disease.
Ishizuka Y, Hanamura K. Ishizuka Y, et al. Adv Exp Med Biol. 2017;1006:203-223. doi: 10.1007/978-4-431-56550-5_12. Adv Exp Med Biol. 2017. PMID: 28865022 Review.
Cited by
- The toxicity of amyloid β oligomers.
Zhao LN, Long HW, Mu Y, Chew LY. Zhao LN, et al. Int J Mol Sci. 2012;13(6):7303-7327. doi: 10.3390/ijms13067303. Epub 2012 Jun 13. Int J Mol Sci. 2012. PMID: 22837695 Free PMC article. Review. - Gut-brain connection: The neuroprotective effects of the anti-diabetic drug liraglutide.
Candeias EM, Sebastião IC, Cardoso SM, Correia SC, Carvalho CI, Plácido AI, Santos MS, Oliveira CR, Moreira PI, Duarte AI. Candeias EM, et al. World J Diabetes. 2015 Jun 25;6(6):807-27. doi: 10.4239/wjd.v6.i6.807. World J Diabetes. 2015. PMID: 26131323 Free PMC article. Review. - Cardiotrophin-1 (CT-1) improves high fat diet-induced cognitive deficits in mice.
Wang D, Liu L, Yan J, Wu W, Zhu X, Wang Y. Wang D, et al. Neurochem Res. 2015 Apr;40(4):843-53. doi: 10.1007/s11064-015-1535-z. Epub 2015 Feb 12. Neurochem Res. 2015. PMID: 25672823 - Effects of long-term treatment with pioglitazone on cognition and glucose metabolism of PS1-KI, 3xTg-AD, and wild-type mice.
Masciopinto F, Di Pietro N, Corona C, Bomba M, Pipino C, Curcio M, Di Castelnuovo A, Ciavardelli D, Silvestri E, Canzoniero LM, Sekler I, Pandolfi A, Sensi SL. Masciopinto F, et al. Cell Death Dis. 2012 Dec 20;3(12):e448. doi: 10.1038/cddis.2012.189. Cell Death Dis. 2012. PMID: 23254291 Free PMC article. - Alzheimer's disease and insulin resistance: translating basic science into clinical applications.
De Felice FG. De Felice FG. J Clin Invest. 2013 Feb;123(2):531-9. doi: 10.1172/JCI64595. Epub 2013 Feb 1. J Clin Invest. 2013. PMID: 23485579 Free PMC article. Review.
References
- Scheibel ME, Lindsay RD, Tomiyasu U, Scheibel AB. Progressive dendritic changes in aging human cortex. Exp Neurol. 1975:47392–47403. - PubMed
- Terry RD, et al. Physical basis of cognitive alterations in Alzheimer's disease: synapse loss is the major correlate of cognitive impairment. Ann Neurol. 1991;30:572–580. - PubMed
- Klein WL, Krafft GA, Finch CE. Targeting small A beta oligomers: the solution to an Alzheimer's disease conundrum? Trends Neurosci. 2001;24:219–224. - PubMed
Publication types
MeSH terms
Substances
Grants and funding
- R01-AG18877/AG/NIA NIH HHS/United States
- R01 AG018877/AG/NIA NIH HHS/United States
- HHMI/Howard Hughes Medical Institute/United States
- R01 AG022547/AG/NIA NIH HHS/United States
- R01-AG22547/AG/NIA NIH HHS/United States
LinkOut - more resources
Full Text Sources
Other Literature Sources
Medical
Molecular Biology Databases


