The stability of mRNA influences the temporal order of the induction of genes encoding inflammatory molecules - PubMed (original) (raw)
The stability of mRNA influences the temporal order of the induction of genes encoding inflammatory molecules
Shengli Hao et al. Nat Immunol. 2009 Mar.
Abstract
The inflammatory response plays out over time in a reproducible and organized way after an initiating stimulus. Here we show that genes activated in cultured mouse fibroblasts in response to the cytokine tumor necrosis factor could be categorized into roughly three groups, each with different induction kinetics. Although differences in transcription were important in determining the grouping of these genes, differences in mRNA stability also exerted a strong influence on the temporal order of gene expression, in some cases overriding that of transcriptional control elements. Transcripts of mRNA expressed early had abundant AU-rich elements in their 3' untranslated regions, whereas those expressed later had fewer. Thus, mRNA stability and transcriptional control, two intrinsic characteristics of genes, control the kinetics of gene expression induced by proinflammatory cytokines.
Figures
Figure 1
TNF-activated genes fall into three kinetically different groups. (a) Microarray analysis of gene expression in 3T3 fibroblasts stimulated with recombinant mouse TNF (10 ng/ml) for 0.5, 2, and 12 hours. Activated genes, defined by an induction ratio equal to or greater than 2-fold (P < 0.01), are shown in green and were clustered with an Agglomerative Clustering Algorithm into three groups (I, II, III). Genes suppressed by TNF treatment are shown in red. The number of genes in each group is shown in parentheses. (b). Representative kinetics of expression of genes in each group.
Figure 2
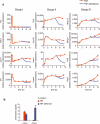
Gene expression after TNF withdrawal (a) 3T3 fibroblasts were exposed to TNF (10 ng/ml) continuously for 10 hours (TNF; red line), or were exposed to TNF for 6 hours, after which TNF was washed away (TNF withdrawal; blue line). Expression of genes in each group was measured by qRT-PCR at indicated time points. The data are mean ± s.d. of triplicate samples and are representative of three to six independent experiments with similar results. (b). 3T3 fibroblasts were stimulated with medium alone (Medium) or with TNF for 6 hours (TNF), or were exposed to TNF for 6 hours after which TNF was washed away and cells were incubated in medium for an additional 18 hours (TNF withdrawal). CCL2 and CCL5 protein in supernatants were measured by ELISA. Note that the production of CCL2 and CCL5 in medium alone was too low (approximately 20 pg/ml) to be shown and CCL5 production is delayed in kinetics and thus lower comparing with CCL2. The data are mean ± s.d. of triplicate samples and representative of three independent experiments with similar results.
Figure 3
mRNA stability of genes in each group. mRNA transcripts encoding the indicated genes were measured by qRT-PCR at indicated times after addition of the transcription inhibitor actinomycin D (ActD) to 3T3 fibroblasts. The results are shown as a ratio to the base line value measured just before ActD addition (in log base 2 scale). Group I, II, and III genes are shown in red, green and blue, respectively. All values were normalized to Rpl32. The data are an average of triplicate samples with variations less than 20% and representative of three independent experiments with similar results.
Figure 4
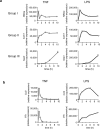
Kinetic patterns of gene expression in macrophages. Bone marrow-derived macrophages were stimulated with TNF (left) or LPS (right) for the indicated times and gene expression was measured by qRT-PCR. (a) The expression of one representative gene in each group is shown; additional genes are shown in Table 1. (b) Altered expression patterns of Ccl2 and Il1b induced by LPS compared to TNF. The data are mean ± s.d. of triplicate samples and representative of three independent experiments with similar results.
Figure 5
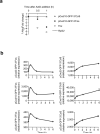
Gene expression patterns are determined by the 3′UTR of a gene. (a) 3T3 fibroblasts were infected with lentiviruses encoding GFP transgenes linked to the promoter of Cxcl10 and the 3′UTR of Ccl5 or Fos. Cells were pre-treated with TNF for 30 minutes before the addition of actinomycin D (ActD). mRNA transcripts encoding GFP, and endogenous Fos and Rpl32, were measured by qRT-PCR at indicated times after addition of ActD. The data are an average of triplicate samples with variations less than 20% and representative of three independent experiments. (b) 3T3 fibroblasts infected with the indicated lentiviruses were stimulated with TNF (20ng/ml). GFP expression was measured by qRT-PCR at indicated time points after the addition of TNF. The data are mean ± s.d. of triplicate samples and representative of three independent experiments with similar results.
Comment in
- Intrinsic mRNA stability helps compose the inflammatory symphony.
Anderson P. Anderson P. Nat Immunol. 2009 Mar;10(3):233-4. doi: 10.1038/ni0309-233. Nat Immunol. 2009. PMID: 19221551 No abstract available.
Similar articles
- Intrinsic mRNA stability helps compose the inflammatory symphony.
Anderson P. Anderson P. Nat Immunol. 2009 Mar;10(3):233-4. doi: 10.1038/ni0309-233. Nat Immunol. 2009. PMID: 19221551 No abstract available. - The androgen derivative 5alpha-androstane-3beta,17beta-diol inhibits tumor necrosis factor alpha and lipopolysaccharide induced inflammatory response in human endothelial cells and in mice aorta.
Norata GD, Cattaneo P, Poletti A, Catapano AL. Norata GD, et al. Atherosclerosis. 2010 Sep;212(1):100-6. doi: 10.1016/j.atherosclerosis.2010.05.015. Epub 2010 May 19. Atherosclerosis. 2010. PMID: 20557886 - Tumor necrosis factor α induces sustained signaling and a prolonged and unremitting inflammatory response in rheumatoid arthritis synovial fibroblasts.
Lee A, Qiao Y, Grigoriev G, Chen J, Park-Min KH, Park SH, Ivashkiv LB, Kalliolias GD. Lee A, et al. Arthritis Rheum. 2013 Apr;65(4):928-38. doi: 10.1002/art.37853. Arthritis Rheum. 2013. PMID: 23335080 Free PMC article. - Inflammation-regulated mRNA stability and the progression of vascular inflammatory diseases.
Herman AB, Autieri MV. Herman AB, et al. Clin Sci (Lond). 2017 Nov 6;131(22):2687-2699. doi: 10.1042/CS20171373. Print 2017 Nov 15. Clin Sci (Lond). 2017. PMID: 29109302 Free PMC article. Review. - Post-transcriptional control during chronic inflammation and cancer: a focus on AU-rich elements.
Khabar KS. Khabar KS. Cell Mol Life Sci. 2010 Sep;67(17):2937-55. doi: 10.1007/s00018-010-0383-x. Epub 2010 May 22. Cell Mol Life Sci. 2010. PMID: 20495997 Free PMC article. Review.
Cited by
- Tristetraprolin (TTP) coordinately regulates primary and secondary cellular responses to proinflammatory stimuli.
Qiu LQ, Lai WS, Bradbury A, Zeldin DC, Blackshear PJ. Qiu LQ, et al. J Leukoc Biol. 2015 Apr;97(4):723-36. doi: 10.1189/jlb.3A0214-106R. Epub 2015 Feb 5. J Leukoc Biol. 2015. PMID: 25657290 Free PMC article. - Coordinated regulation of synthesis and stability of RNA during the acute TNF-induced proinflammatory response.
Paulsen MT, Veloso A, Prasad J, Bedi K, Ljungman EA, Tsan YC, Chang CW, Tarrier B, Washburn JG, Lyons R, Robinson DR, Kumar-Sinha C, Wilson TE, Ljungman M. Paulsen MT, et al. Proc Natl Acad Sci U S A. 2013 Feb 5;110(6):2240-5. doi: 10.1073/pnas.1219192110. Epub 2013 Jan 23. Proc Natl Acad Sci U S A. 2013. PMID: 23345452 Free PMC article. - HIF-1α-PDK1 axis-induced active glycolysis plays an essential role in macrophage migratory capacity.
Semba H, Takeda N, Isagawa T, Sugiura Y, Honda K, Wake M, Miyazawa H, Yamaguchi Y, Miura M, Jenkins DM, Choi H, Kim JW, Asagiri M, Cowburn AS, Abe H, Soma K, Koyama K, Katoh M, Sayama K, Goda N, Johnson RS, Manabe I, Nagai R, Komuro I. Semba H, et al. Nat Commun. 2016 May 18;7:11635. doi: 10.1038/ncomms11635. Nat Commun. 2016. PMID: 27189088 Free PMC article. - IL-1β-specific recruitment of GCN5 histone acetyltransferase induces the release of PAF1 from chromatin for the de-repression of inflammatory response genes.
Kim N, Sun HY, Youn MY, Yoo JY. Kim N, et al. Nucleic Acids Res. 2013 Apr;41(8):4495-506. doi: 10.1093/nar/gkt156. Epub 2013 Mar 14. Nucleic Acids Res. 2013. PMID: 23502002 Free PMC article. - MicroRNAs distinguish translational from transcriptional silencing during endotoxin tolerance.
El Gazzar M, McCall CE. El Gazzar M, et al. J Biol Chem. 2010 Jul 2;285(27):20940-51. doi: 10.1074/jbc.M110.115063. Epub 2010 Apr 30. J Biol Chem. 2010. PMID: 20435889 Free PMC article.
References
- Majno G. The Healing Hand: Man and Wound in the Ancient World. Harvard University Press; Cambridge: 1975.
- Stramer BM, Mori R, Martin P. The inflammation-fibrosis link? A Jekyll and Hyde role for blood cells during wound repair. J Invest Dermatol. 2007;127:1009–17. - PubMed
- Bradley JR. TNF-mediated inflammatory disease. J Pathol. 2008;214:149–60. - PubMed
- Beg AA, Baltimore D. An essential role for NF-kappaB in preventing TNF-alpha-induced cell death. Science. 1996;274:782–4. - PubMed
Publication types
MeSH terms
Substances
LinkOut - more resources
Full Text Sources
Other Literature Sources
Molecular Biology Databases


