Hepatitis C virus infection of T cells inhibits proliferation and enhances fas-mediated apoptosis by down-regulating the expression of CD44 splicing variant 6 - PubMed (original) (raw)
Hepatitis C virus infection of T cells inhibits proliferation and enhances fas-mediated apoptosis by down-regulating the expression of CD44 splicing variant 6
Yasuteru Kondo et al. J Infect Dis. 2009.
Abstract
Background: A lymphotropic hepatitis C virus strain (HCV, SB strain, hereafter "SB-HCV") has been shown to infect established T cell lines (Molt-4 and Jurkat) and primary human naive CD4(+) T cells. During T cell development and activation, transient expression of CD44 splicing variant 6 (CD44v6) plays a significant role.
Methods: SB-HCV was used to infect Molt-4 cells, and their cellular proliferation and CD44 expression was examined.
Results: SB-HCV-infected Molt-4 cells expressed a significantly lower level of the CD44v6 isoform. The infected cells could be divided into 2 carboxyfluorescein succinimidyl ester (CFSE) groups, CFSE-high (indicating low proliferation activity; 34.2% of the cells) and CFSE-low (indicating high proliferation activity; 62.5% of the cells), whereas uninfected cells consisted of only a CFSE-low population. Of the CFSE-high cells, 82.4% were positive for the HCV protein NS5A, whereas only 1.2% of the CFSE-low cells were positive for this protein. Among the HCV proteins, NS5A alone caused the down-regulation of CD44v6 expression. After cells were stimulated with phorbol myristate acetate, the amount of phosphorylated mitogen-activated protein (MAP) kinase was significantly reduced in CFSE-high, SB-HCV-infected Molt-4 cells. After Fas ligand stimulation, SB-HCV-infected Molt-4 cells had increased cleavage of caspase 8 and 3 and enhanced apoptosis, compared with the rates of cleavage and apoptosis in control groups, indicating that SB-HCV infection increased Fas-mediated apoptosis.
Conclusion: HCV replication in T cells suppresses cellular proliferation and enhances susceptibility to Fas signaling by inhibiting CD44v6 signaling and expression.
Conflict of interest statement
Potential conflicts of interest: none reported.
Figures
Figure 1
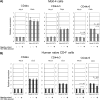
Quantification of standard CD44 (CD44s) mRNA as well as mRNA from splicing variants 3 and 6 (CD44v3 and CD44v6) in Molt-4 cells (A) and human CD45RA+CD45RO− naive T cells (B) (samples obtained from 1 healthy subject). Quantification of CD44s, CD44v3, and CD44v6 mRNA with or without stimulation (phorbol myristate acetate [PMA] or anti-CD3 antibody [CD3]) was carried out by real-time polymerase chain reaction with comparative cycle threshold methods. Five independent experiments yielded similar results. Mock, mock-infected cells; HCV, cells infected with hepatitis C virus, strain SB; UV, cells infected with UV-irradiated hepatitis C virus, strain SB.
Figure 2
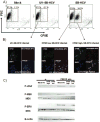
Comparison of surface expression of standard CD44 (CD44s) and splicing variants 3 and 6 (CD44v3 and CD44v6) in Molt-4 cells. A, Comparison of mean fluorescence intensity (MFI) among the 3 groups with or without phorbol myristate acetate (PMA) stimulation was carried out with flow cytometry. The percentage MFI was calculated as follows: target mean fluorescence intensity divided by mean fluorescence intensity of mock-infected cells without PMA stimulation times 100. Three independent experiments yielded similar results. B, Fluorescence-activated cell sorter analyses of surface expression of different CD44 isoforms. Red lines, mock-infected Molt-4 cells; black lines, Molt-4 cells infected with UV-irradiated hepatitis C virus, strain SB (UV–SB-HCV); green lines, Molt-4 cells infected with SB-HCV.
Figure 3
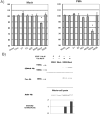
NS5A protein and suppression of CD44v6 in T cells. A, Effects of individual hepatitis C virus (HCV) proteins on surface expression of CD44 splicing variant 6 (CD44v6). Mean fluorescence intensity (MFI) of CD44v6 on Molt-4 cells transfected with individual HCV proteins was normalized by the MFI of CD44v6 on mock-infected Molt-4 cells. Five independent experiments yielded similar results. B, Coimmunoprecipitation of CD44v6 with Fas. Cell lysates were precipitated with anti-Fas antibody (Fas Ab) and detected by immunoblotting with different antibodies. Band intensity was analyzed with Image J (National Institutes of Health). The bar graph shows the relative intensity of CD44v6 and actin. Three independent experiments yielded similar results. IP, immunoprecipitation; STAT-1 Ab, anti–signal transducer and activator of transcription factor 1 antibody.
Figure 4
Detection of positive- and negative-strand hepatitis C virus, SB strain (SB-HCV), RNA by semiquantitative reverse-transcriptase polymerase chain reaction. JFH-1-HCV, JFH-1 HCV strain; UV–JFH-1-HCV, UV irradiated JFH-1-HCV; UV–SB-HCV, UV irradiated SB-HCV.
Figure 5
Effects of hepatitis C virus, strain SB (SB-HCV), infection on cell proliferation in Molt-4 cells. A, Representative fluorescence-activated cell sorter (FACS) analysis of cell proliferation. B, Carboxyfluorescein succinimidyl ester (CFSE)–high and CFSE-low groups were separated by FACS analysis and analyzed for NS5A expression by immunofluoresence analysis. Green stain, CFSE; red stain, NS5A; blue stain, 4′,6–diamidino–phenylindole dihydrochloride (DAPI). The percentage of infectivity was determined by counting numbers of positively stained cells per 400 cells. For the negative control, cells treated with UV-irradiated HCV and detection antibody alone were used. C, Analysis of Ras/mitogen-activated protein (MAP) kinase/extracellular signal-regulated kinase kinase (MEK)/extracellular signal-regulated kinase (ERK) signaling. For details about immunoblotting analysis, see Methods. Three independent experiments yielded similar results. FSC, forward scatter characteristics; P-cRaf, phospho-cRaf; P-ERK, phospho-ERK; P-MEK, phospho-MEK.
Figure 6
Comparison of carboxyfluorescein succinimidyl ester (CFSE)-low cells and CFSE-high cells (i.e., cells highly infected with hepatitis C virus, strain SB [SB-HCV]) with respect to expression of standard CD44 (CD44s) and the splicing variants 3 and 6 (CD44v3 and CD44v6). A, Representative graphs show CFSE intensity among mock-infected cells, cells infected with UV-irradiated SB-HCV (UV–SB-HCV), and cells infected with SB-HCV. B, CD44s and CD44v3 were only weakly suppressed in the SB-HCV–infected CFSE-high cells, compared with the CFSE-low group. Three independent experiments yielded similar results. MFI, mean fluorescence intensity.
Figure 7
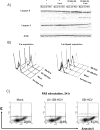
Susceptibility of different cells to Fas stimulation. A, Immunoblotting analysis was carried out by using anti-caspase 8, anti-caspase 3, and anti-actin antibodies, and the membrane was then subjected to reaction with peroxidase-conjugated secondary antibody. Immunoreactivity was visualized by use of enhanced chemiluminescence detection. Loading proteins were obtained from the following cell groups: mock-infected Molt-4 cells; Molt-4 cells infected with UV-irradiated hepatitis C virus, strain B (UV–SB-HCV); SB-HCV–infected Molt-4 cells from the carboxyfluorescein succinimidyl ester (CFSE)–high group; and SB-HCV–infected Molt-4 cells from the CFSE-low group, with or without Fas-ligand (FasL) stimulation. Pretreatment with CD44 splicing variant 6–blocking antibody (CD44v6 Ab) was carried out for some samples, as indicated. B, Surface expression of Fas and FasL as measured by flow cytometry. C, Fluorescence-activated cell sorter analysis of annexin V and propidium iodide (PI) staining. Mock-infected cells, Molt-4 cells infected with UV-SB-HCV, and Molt-4 cells infected with SB-HCV were stimulated with FasL for 24 h and analyzed to detect annexin V–positive, PI–negative early apoptotic cells. The percentages of early apoptotic cells in each group are indicated in the dot plots. Iso-type cont., isotype control antibodies.
Figure 8
A proposed mechanism for T cell hyporesponsiveness induced by hepatitis C virus, strain SB (SB-HCV). T cell proliferation activity is strongly suppressed in SB-HCV infected T cells (thick arrows). A second effect is the induction of apoptosis through Fas. Both pathways lead to T cell hyporesponsiveness. The relative effects of these 2 pathways is not clear. CFSE, carboxyfluorescein succinimidyl ester.
Similar articles
- Nonstructural 3 Protein of Hepatitis C Virus Modulates the Tribbles Homolog 3/Akt Signaling Pathway for Persistent Viral Infection.
Tran SC, Pham TM, Nguyen LN, Park EM, Lim YS, Hwang SB. Tran SC, et al. J Virol. 2016 Jul 27;90(16):7231-7247. doi: 10.1128/JVI.00326-16. Print 2016 Aug 15. J Virol. 2016. PMID: 27252525 Free PMC article. - Osteopontin Regulates Hepatitis C Virus (HCV) Replication and Assembly by Interacting with HCV Proteins and Lipid Droplets and by Binding to Receptors αVβ3 and CD44.
Iqbal J, Sarkar-Dutta M, McRae S, Ramachandran A, Kumar B, Waris G. Iqbal J, et al. J Virol. 2018 Jun 13;92(13):e02116-17. doi: 10.1128/JVI.02116-17. Print 2018 Jul 1. J Virol. 2018. PMID: 29669827 Free PMC article. - A comparative cell biological analysis reveals only limited functional homology between the NS5A proteins of hepatitis C virus and GB virus B.
Mankouri J, Milward A, Pryde KR, Warter L, Martin A, Harris M. Mankouri J, et al. J Gen Virol. 2008 Aug;89(Pt 8):1911-1920. doi: 10.1099/vir.0.2008/001131-0. J Gen Virol. 2008. PMID: 18632962 - Deoxycholic acid (DCA) causes ligand-independent activation of epidermal growth factor receptor (EGFR) and FAS receptor in primary hepatocytes: inhibition of EGFR/mitogen-activated protein kinase-signaling module enhances DCA-induced apoptosis.
Qiao L, Studer E, Leach K, McKinstry R, Gupta S, Decker R, Kukreja R, Valerie K, Nagarkatti P, El Deiry W, Molkentin J, Schmidt-Ullrich R, Fisher PB, Grant S, Hylemon PB, Dent P. Qiao L, et al. Mol Biol Cell. 2001 Sep;12(9):2629-45. doi: 10.1091/mbc.12.9.2629. Mol Biol Cell. 2001. PMID: 11553704 Free PMC article. - Authentic Patient-Derived Hepatitis C Virus Infects and Productively Replicates in Primary CD4+ and CD8+ T Lymphocytes In Vitro.
Skardasi G, Chen AY, Michalak TI. Skardasi G, et al. J Virol. 2018 Jan 17;92(3):e01790-17. doi: 10.1128/JVI.01790-17. Print 2018 Feb 1. J Virol. 2018. PMID: 29167333 Free PMC article.
Cited by
- Sequential immunological analysis of HBV/HCV co-infected patients during Peg-IFN/RBV therapy.
Kondo Y, Ueno Y, Ninomiya M, Tamai K, Tanaka Y, Inoue J, Kakazu E, Kobayashi K, Kimura O, Miura M, Yamamoto T, Kobayashi T, Igarashi T, Shimosegawa T. Kondo Y, et al. J Gastroenterol. 2012 Dec;47(12):1323-35. doi: 10.1007/s00535-012-0596-x. Epub 2012 May 16. J Gastroenterol. 2012. PMID: 22588246 - Virologic and immunologic aspects of HIV-hepatitis C virus coinfection.
Chew KW, Bhattacharya D. Chew KW, et al. AIDS. 2016 Oct 23;30(16):2395-2404. doi: 10.1097/QAD.0000000000001203. AIDS. 2016. PMID: 27427873 Free PMC article. Review. - Modulation of IL-2 expression after uptake of hepatitis C virus non-enveloped capsid-like particles: the role of p38 kinase.
Serti E, Doumba PP, Thyphronitis G, Tsitoura P, Katsarou K, Foka P, Konstandoulakis MM, Koskinas J, Mavromara P, Georgopoulou U. Serti E, et al. Cell Mol Life Sci. 2011 Feb;68(3):505-22. doi: 10.1007/s00018-010-0466-8. Epub 2010 Jul 31. Cell Mol Life Sci. 2011. PMID: 20680391 Free PMC article. - HCV infection enhances Th17 commitment, which could affect the pathogenesis of autoimmune diseases.
Kondo Y, Ninomiya M, Kimura O, Machida K, Funayama R, Nagashima T, Kobayashi K, Kakazu E, Kato T, Nakayama K, Lai MM, Shimosegawa T. Kondo Y, et al. PLoS One. 2014 Jun 6;9(6):e98521. doi: 10.1371/journal.pone.0098521. eCollection 2014. PLoS One. 2014. PMID: 24905921 Free PMC article. - Immune Checkpoint Inhibitor Can Reduce HCV-RNA without Liver Damage.
Fukuda R, Sugawara S, Kondo Y. Fukuda R, et al. Intern Med. 2020 Sep 15;59(18):2245-2248. doi: 10.2169/internalmedicine.3726-19. Epub 2020 Jun 9. Intern Med. 2020. PMID: 32522918 Free PMC article.
References
- Alter MJ, Kruszon-Moran D, Nainan OV, et al. The prevalence of hepatitis C virus infection in the United States, 1988 through 1994. N Engl J Med. 1999;341:556–62. - PubMed
- Chang KM, Rehermann B, Chisari FV. Immunopathology of hepatitis C. Springer Semin Immunopathol. 1997;19:57–68. - PubMed
- Manigold T, Racanelli V. T-cell regulation by CD4 regulatory T cells during hepatitis B and C virus infections: facts and controversies. Lancet Infect Dis. 2007;7:804–13. - PubMed
- Blackburn SD, Wherry EJ. IL-10, T cell exhaustion and viral persistence. Trends Microbiol. 2007;15:143–6. - PubMed
- Kondo Y, Sung VM, Machida K, Liu M, Lai MM. Hepatitis C virus infects T cells and affects interferon-gamma signaling in T cell lines. Virology. 2007;361:161–73. - PubMed
Publication types
MeSH terms
Substances
Grants and funding
- N01AI40038/AI/NIAID NIH HHS/United States
- CA108302/CA/NCI NIH HHS/United States
- R01 AA018857/AA/NIAAA NIH HHS/United States
- R01 CA108302/CA/NCI NIH HHS/United States
- P50 AA011999/AA/NIAAA NIH HHS/United States
LinkOut - more resources
Full Text Sources
Research Materials
Miscellaneous


