Intestinal tolerance is converted to autoimmune enteritis upon PD-1 ligand blockade - PubMed (original) (raw)
Intestinal tolerance is converted to autoimmune enteritis upon PD-1 ligand blockade
Erika D Reynoso et al. J Immunol. 2009.
Abstract
The B7 family member programmed death-1 ligand (PD-L1) has been shown to play an inhibitory role in the regulation of T cell responses in several organs. However, the role of PD-L1 in regulating tolerance to self-Ags of the small intestine has not been previously addressed. In this study, we investigated the role of PD-L1 in CD8(+) T cell tolerance to an intestinal epithelium-specific Ag using the iFABP-tOVA transgenic mouse model, in which OVA is expressed as a self-Ag throughout the small intestine. Using adoptive transfer of naive OVA-specific CD8(+) T cells, we show that loss of PD-1:PD-L1 signaling, by either Ab-mediated PD-L1 blockade or transfer of PD-1(-/-) T cells, leads to considerable expansion of OVA-specific CD8(+) T cells and their differentiation into effector cells capable of producing proinflammatory cytokines. A fatal CD8(+) T cell-mediated inflammatory response develops rapidly against the small bowel causing destruction of the epithelial barrier, severe blunting of intestinal villi, and recruitment and activation of myeloid cells. This response is highly specific because immune destruction selectively targets the small intestine but not other organs. Collectively, these results indicate that loss of the PD-1:PD-L1 inhibitory pathway breaks CD8(+) T cell tolerance to intestinal self-Ag, thus leading to severe enteric autoimmunity.
Figures
FIGURE 1
Surface PD-L1 is expressed by DCs, LNSCs, and T cells, but not IECs. Expression of PD-L1 on DCs, LNSCs, IECs, polyclonal CD8+ T cells, and OT-I TCR transgenic T cells (gated on 7-aminoactinomycin D (7AAD)−CD45+CD11chigh, 7AAD−CD45−, 7AAD−CD45− UEA-I+, CD45+CD8+, and CD8+V_α_2+ cells, respectively) was analyzed by flow cytometry. Overlays depict staining with anti-PD-L1 Ab for the indicated cell-type (open histogram) compared with isotype control (gray-filled histogram). For each cell type, tissues from n = 3–6 individual mice were analyzed and representative results are shown.
FIGURE 2
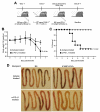
PD-L1 blockade leads to significant weight loss, severe intestinal inflammation, and death. A, Schematic of Ab treatment and T cell transfer regimen. Mice were injected i.p. with 200 _μ_g of anti-PD-L1 Ab or isotype control. One day later, naive congenic CD45.1+ OT-I T cells were transferred i.v. into CD45.2+ C57BL/6 or iFABP-tOVA recipients. Mice were weighed starting on the day of transfer (day 0) and daily thereafter until the mice were euthanized 5–7 days posttransfer. Mice were treated with Ab every other day throughout the experiment. B, Impact of anti-PD-L1 treatment on body weight. Data represent mean ± SD of body weight plotted as a percentage of baseline weight at day 0 for isotype-treated mice (n = 7) and anti-PD-L1-treated iFABP-tOVA mice (n = 6). C, Effect of anti-PD-L1 treatment on the survival of iFABP-tOVA mice. Survival percentage of anti-PD-L1-treated iFABP-tOVA mice (n = 7) was compared with isotype-treated iFABP-tOVA mice (n = 4). D, Whole mounts of the small intestine from isotype-treated and anti-PD-L1-treated C57BL/6 and iFABP-tOVA mice. Images show representative tissues excised from isotype and anti-PD-L1-treated mice 5–7 days after T cell transfer.
FIGURE 3
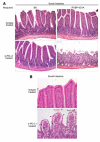
Lack of PD-L1 signaling leads to altered intestinal histology. A, Histology of the small intestine from isotype and anti-PD-L1-treated C57BL/6 and iFABP-tOVA mice 5–7 days posttransfer of T cells. Tissues were fixed and processed for H&E staining. Images at a magnification of ×20 show representative histology of the small intestine for each condition. B, Images at a magnification of ×40 show representative histology of intestinal villi for each condition with apoptotic epithelial cells indicated (arrowhead).
FIGURE 4
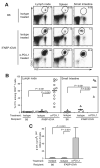
PD-L1 inhibits the accumulation of gut-reactive CD8+ T cells. A, Accumulation of transferred CD45.1+ OT-I T cells in lymphoid tissues and small intestines of isotype-treated CD45.2+ C57BL/6 and iFABP-tOVA mice and anti-PD-L1-treated iFABP-tOVA mice. Donor-derived (CD45.1+) OT-I T cells were enumerated 5–7 days posttransfer by flow cytometry. Representative dot plots are shown and values at gate indicate percentage of OT-I T cells among total CD8+ cells. B, Graphic representation of data shown in A for lymph nodes (circles) and intestine (triangles). Data represent the percentage of donor OT-I T cells among total CD8+ T cells as mean ± SD for lymph nodes and small intestine. C, Absolute number of OT-I T cells in lymph nodes from data shown in B. Data represent the mean number ± SD of donor OT-I T cells per 106 lymph node cells for each tissue.
FIGURE 5
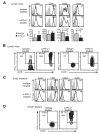
Gut-specific CD8+ T cells acquire effector function upon PD-L1 blockade. Activation of CD45.1+ OT-I T cells in isotype and anti-PD-L1-treated iFABP-tOVA mice. Expression of CD25, CD44, CD62L, and CD69 by donor OT-I T cells (gated on CD8+V_α_2+CD45.1+ cells) in lymph nodes (A) and small intestine (C) was analyzed by flow cytometry. Overlays depict the expression of the indicated markers by OT-I T cells (open histogram) from isotype and anti-PD-L1-treated iFABP-tOVA mice compared with isotype Ab staining (gray-filled histogram). Values indicate the mean fluorescence intensity (MFI) of OT-I T cells for the indicated marker. For each condition, n = 3–6 individual mice were analyzed, and representative histograms are shown. Results represent the mean fluorescence intensity ± SD for the indicated markers on donor OT-I T cells isolated from lymph nodes. Cytokine production by CD45.1+ OT-I T cells in lymph nodes (B) and small intestines (D) from isotype and anti-PD-L1-treated iFABP-tOVA mice analyzed by intracellular cytokine staining and flow cytometry. The n = 3–9 individual mice were analyzed for each condition and representative contour plots are shown. Values at gate indicate percentage of cells among CD8+V_α_2+ cells and mean fluorescence intensity for IFN-γ or TNF-α.
FIGURE 6
PD-L1 blockade can affect self-reactive CD8+ T cell function early upon Ag encounter in iFABP-tOVA mice. A, Surface anti-PD-1 staining on naive OT-I T cells gated on CD8+V_α_2+ CD45.1+ cells (open histogram) before transfer compared with isotype control (gray-filled histogram). Value in histogram indicates mean fluorescence intensity (MFI) for PD-1. B, Overlays depict PD-1 expression by OT-I T cells isolated from lymph nodes 4 days after adoptive transfer into isotype and anti-PD-L1-treated C57BL/6 (gray line histogram) and iFABP-tOVA (open histogram) mice compared with isotype control (gray-filled histogram). Values in histograms indicate mean fluorescence intensity for PD-1. C, Surface PD-1 expression over time on OT-I T cells isolated from lymph nodes of isotype and anti-PD-L1-treated C57BL/6 and iFABP-tOVA mice. Data represent the mean fluorescence intensity ± SD for PD-1 expression on OT-I T cells (n = 3 mice for each condition).
FIGURE 7
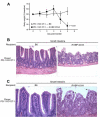
PD-1 deficiency in gut-specific CD8+ T cells leads to autoimmune enteritis. A, Weight of mice following transfer of PD-1−/− OT-I T cells. Mice were weighed starting on the day of transfer (day 0) and daily thereafter until the mice were euthanized. Data represent mean body weight ± SD plotted as a percentage of baseline weight at day 0 for C57BL/6 mice (n = 6) and iFABP-tOVA mice (n = 12). B, Histology of the small intestine from C57BL/6 and iFABP-tOVA mice 5 days after transfer of PD-1−/− OT-I T cells. Tissues were fixed and processed for H&E staining. Images at a magnification of ×20 show representative histology of the small intestine for each condition. C, Histology of intestinal villi from small intestines of C57BL/6 and iFABP-tOVA mice 5 days after transfer of PD-1−/− OT-I T cells. Tissues were fixed and processed for H&E staining. Images at a magnification of ×40 show representative histology of intestinal villi for each condition (arrowhead), indicating apoptotic epithelial cells.
FIGURE 8
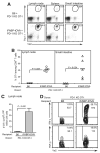
PD-1 deficiency allows gut-specific CD8+ T cells to accumulate, and acquire effector function. A, Accumulation of transferred Thy1.1+ PD-1−/− OT-I T cells in lymphoid tissues and small intestines of C57BL/6 and iFABP-tOVA mice. OT-I T cell accumulation was assessed 5 days posttransfer by enumerating donor-derived (Thy1.1+) PD-1−/− OT-I T cells. Values at gate indicate the percentage of OT-I T cells among total CD8+ cells. B, Graphic of data shown in A for lymph nodes (circles) and intestine (triangles). Data represent mean ± SD of the percentage of donor PD-1−/− OT-I T cells among total CD8+ T cells. C, Absolute number of PD-1−/− OT-I T cells in lymph nodes from data shown in B. Data represent the mean number ± SD of donor OT-I T cells per 106 lymph node cells. D, Cytokine production by PD-1−/− OT-I T cells in lymph nodes from C57BL/6 and iFABP-tOVA mice analyzed by intracellular cytokine staining and flow cytometry. For each condition, n = 3–5 individual mice were analyzed and representative contour plots are shown. Values in gate indicate the percentage of cells among CD8+ cells and the mean fluorescence intensity for IFN-γ or TNF-α.
Similar articles
- Cutting Edge: Programmed death (PD) ligand-1/PD-1 interaction is required for CD8+ T cell tolerance to tissue antigens.
Martin-Orozco N, Wang YH, Yagita H, Dong C. Martin-Orozco N, et al. J Immunol. 2006 Dec 15;177(12):8291-5. doi: 10.4049/jimmunol.177.12.8291. J Immunol. 2006. PMID: 17142723 - PD-1 regulates self-reactive CD8+ T cell responses to antigen in lymph nodes and tissues.
Keir ME, Freeman GJ, Sharpe AH. Keir ME, et al. J Immunol. 2007 Oct 15;179(8):5064-70. doi: 10.4049/jimmunol.179.8.5064. J Immunol. 2007. PMID: 17911591 - LAG-3, TGF-β, and cell-intrinsic PD-1 inhibitory pathways contribute to CD8 but not CD4 T-cell tolerance induced by allogeneic BMT with anti-CD40L.
Lucas CL, Workman CJ, Beyaz S, LoCascio S, Zhao G, Vignali DA, Sykes M. Lucas CL, et al. Blood. 2011 May 19;117(20):5532-40. doi: 10.1182/blood-2010-11-318675. Epub 2011 Mar 21. Blood. 2011. PMID: 21422469 Free PMC article. - Interaction of PD-L1 on tumor cells with PD-1 on tumor-specific T cells as a mechanism of immune evasion: implications for tumor immunotherapy.
Blank C, Gajewski TF, Mackensen A. Blank C, et al. Cancer Immunol Immunother. 2005 Apr;54(4):307-14. doi: 10.1007/s00262-004-0593-x. Epub 2004 Dec 15. Cancer Immunol Immunother. 2005. PMID: 15599732 Free PMC article. Review. - Negative regulation of T-cell function by PD-1.
Zha Yy, Blank C, Gajewski TF. Zha Yy, et al. Crit Rev Immunol. 2004;24(4):229-37. doi: 10.1615/critrevimmunol.v24.i4.10. Crit Rev Immunol. 2004. PMID: 15588223 Review.
Cited by
- Regulation of T-cell Tolerance by Lymphatic Endothelial Cells.
Rouhani SJ, Eccles JD, Tewalt EF, Engelhard VH. Rouhani SJ, et al. J Clin Cell Immunol. 2014;5:1000242. doi: 10.4172/2155-9899.1000242. J Clin Cell Immunol. 2014. PMID: 25580369 Free PMC article. - Immunosuppression associated with chronic inflammation in the tumor microenvironment.
Wang D, DuBois RN. Wang D, et al. Carcinogenesis. 2015 Oct;36(10):1085-93. doi: 10.1093/carcin/bgv123. Epub 2015 Sep 8. Carcinogenesis. 2015. PMID: 26354776 Free PMC article. Review. - Role of FABP5 in T Cell Lipid Metabolism and Function in the Tumor Microenvironment.
Jin R, Hao J, Yu J, Wang P, Sauter ER, Li B. Jin R, et al. Cancers (Basel). 2023 Jan 20;15(3):657. doi: 10.3390/cancers15030657. Cancers (Basel). 2023. PMID: 36765614 Free PMC article. Review. - Characteristics, treatment, and outcome of diverticulitis after immune checkpoint inhibitor treatment in patients with malignancies.
Thomas AR, Eyada M, Kono M, Varatharajalu K, Lu Y, Xu G, Panneerselvam K, Shatila M, Altan M, Wang J, Thompson JA, Zhang HC, Khan MA, Raju GS, Thomas AS, Wang Y. Thomas AR, et al. J Cancer Res Clin Oncol. 2023 Jul;149(8):4805-4816. doi: 10.1007/s00432-022-04405-3. Epub 2022 Oct 15. J Cancer Res Clin Oncol. 2023. PMID: 36242603 - BTLA expression contributes to septic morbidity and mortality by inducing innate inflammatory cell dysfunction.
Shubin NJ, Chung CS, Heffernan DS, Irwin LR, Monaghan SF, Ayala A. Shubin NJ, et al. J Leukoc Biol. 2012 Sep;92(3):593-603. doi: 10.1189/jlb.1211641. Epub 2012 Mar 29. J Leukoc Biol. 2012. PMID: 22459947 Free PMC article.
References
- Greenwald RJ, Freeman GJ, Sharpe AH. The B7 family revisited. Annu. Rev. Immunol. 2005;23:515–548. - PubMed
- Ishida M, Iwai Y, Tanaka Y, Okazaki T, Freeman GJ, Minato N, Honjo T. Differential expression of PD-L1 and PD-L2, ligands for an inhibitory receptor PD-1, in the cells of lymphohematopoietic tissues. Immunol. Lett. 2002;84:57–62. - PubMed
- Liang SC, Latchman YE, Buhlmann JE, Tomczak MF, Horwitz BH, Freeman GJ, Sharpe AH. Regulation of PD-1, PD-L1, and PD-L2 expression during normal and autoimmune responses. Eur. J. Immunol. 2003;33:2706–2716. - PubMed
Publication types
MeSH terms
Substances
LinkOut - more resources
Full Text Sources
Other Literature Sources
Medical
Molecular Biology Databases
Research Materials

