Accelerated pathological and clinical nephritis in systemic lupus erythematosus-prone New Zealand Mixed 2328 mice doubly deficient in TNF receptor 1 and TNF receptor 2 via a Th17-associated pathway - PubMed (original) (raw)
. 2009 Feb 15;182(4):2532-41.
doi: 10.4049/jimmunol.0802948.
Haitao Yang, Luminita Pricop, Yi Liu, Xiaoni Gao, Song Guo Zheng, Juhua Wang, Hua-Xin Gao, Chaim Putterman, Michael N Koss, William Stohl, Chaim O Jacob
Affiliations
- PMID: 19201910
- PMCID: PMC2790862
- DOI: 10.4049/jimmunol.0802948
Accelerated pathological and clinical nephritis in systemic lupus erythematosus-prone New Zealand Mixed 2328 mice doubly deficient in TNF receptor 1 and TNF receptor 2 via a Th17-associated pathway
Noam Jacob et al. J Immunol. 2009.
Abstract
TNF-alpha has both proinflammatory and immunoregulatory functions. Whereas a protective role for TNF administration in systemic lupus erythematosus (SLE)-prone (New Zealand Black x New Zealand White)F(1) mice has been established, it remains uncertain whether this effect segregates at the individual TNFR. We generated SLE-prone New Zealand Mixed 2328 mice genetically deficient in TNFR1, in TNFR2, or in both receptors. Doubly-deficient mice developed accelerated pathological and clinical nephritis with elevated levels of circulating IgG anti-dsDNA autoantibodies and increased numbers of CD4(+) T lymphocytes, especially activated memory (CD44(high)CD62L(low)) CD4(+) T cells. We show that these cells expressed a Th17 gene profile, were positive for IL-17 intracellular staining by FACS, and produced exogenous IL-17 in culture. In contrast, immunological, pathological, and clinical profiles of mice deficient in either TNFR alone did not differ from those in each other or from those in wild-type controls. Thus, total ablation of TNF-alpha-mediated signaling was highly deleterious to the host in the New Zealand Mixed 2328 SLE model. These observations may have profound ramifications for the use of TNF and TNFR antagonists in human SLE and related autoimmune disorders, as well as demonstrate, for the first time, the association of the Th17 pathway with an animal model of SLE.
Conflict of interest statement
Disclosures: The authors have no financial conflict of interest.
Figures
FIGURE 1
Accelerated proteinuria (A) and mortality (B) in TNFR p55/p75DKO mice. A total of 31–37 female mice for each of the indicated experimental group was monitored up to 12 mo of age. Data are presented as the percentage of cumulative prevalence of severe (≥3+) proteinuria and as percentage of cumulative death at the ages shown. Development of severe proteinuria and mortality are significantly accelerated (p < 0.001 for each) in DKO mice compared with those in the other mouse lines.
FIGURE 2
IgG anti-dsDNA autoantibodies in the different lines of mice at 5–5.5 and 7.5–9 mo of age. n = 7–13 mice in the various groups. Each symbol represents an individual mouse. The composite results are plotted as box plots. The lines inside the boxes indicate the medians; the outer borders of the boxes indicate 25th and 75th percentiles; the bars extending from the boxes indicate the 10th and 90th percentiles. *, p < 0.001 vs other groups at 5–5.5 mo of age.
FIGURE 3
Representative H&E staining (original magnification ×200) and IgG1, IgG2b, and C3 immunofluorescence staining (original magnification ×40) of kidney sections from female NZM 2328 mice with the indicated genotypes and ages. Increased mesangial deposition with some cellularity in the glomeruli of 5.5-mo-old p55/p75 DKO mice and in 7.5-mo-old WT mice is marked with arrows.
FIGURE 4
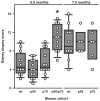
Assessment of renal pathology in the different lines of mice. Data are presented as composite KBS in the NZM 2328 mice with the indicated genotypes at 5.5 mo of age and at 7.5 mo of age. Each symbol represents an individual mouse. Results are plotted as in Fig. 2. *, p < 0.001 vs all other groups at 5.5 mo of age.
FIGURE 5
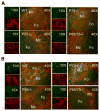
Comparison of spleen follicle structure in NZM 2328 WT and the indicated TNFR-deficient mice. Spleen sections from 2-mo-old (A) and from 6-mo-old (B) female mice from the indicated genotypes were stained with anti-B220 (red) and anti-MOMA-1 (green) mAb. Original magnifications of ×10 and ×40 are shown.
FIGURE 6
Altered GC formation in TNFR-deficient mice. Spleen sections from the indicated strains at 2 and 6 mo of age were stained with peanut agglutinin (red) to detect GC and with anti-B220 (green) for B cells. Original magnification ×40.
FIGURE 7
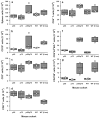
Effects of various TNFR deficiencies on spleen B and T cell subsets in 5- to 5.5-mo-old mice. Numbers shown are millions of cells per spleen. The composite results are plotted as box plots. The lines inside the boxes indicate the medians; the outer borders of the boxes indicate 25th and 75th percentiles; the bars extending from the boxes indicate the 10th and 90th percentiles. There are four mice in each of the indicated test groups analyzed in the same experiments. Results are representative of three independent experiments. a, Total number of splenocytes; b, CD19-positive B lymphocytes; c, CD3-positive total T lymphocytes; d, CD8-positive T cells; e, CD4-positive T cells; f, CD4+ CD44highCD62Llow/neg activated memory T cells; g, CD4+CD69+ recently activated T cells. Value of p < 0.05 among 5.5-mo-old mice for a_–_c; p < 0.01 for e_–_g; no statistical difference for d. Between DKO mice at 5.5 mo of age and WT at 9 mo of age, no significant difference was observed for a–c and e–g.
FIGURE 8
Flow cytometry analyses of T cell subsets in the various lines of mice. Representative FACS dot plots are shown at 5 mo of age in A_–_C, and at 8–9 mo of age in D. All data are representative for at least four independent experiments with similar results. A, Proportional increase of CD4+ and decrease of CD8+ T cells in p55/p75 DKO mice. The numbers shown in quadrants of each plot indicate percentage of total T cells (CD3+). B, Increased activated (CD69+) CD4+ T cells in p55/p75 DKO mice. The numbers shown in the upper right quadrant of each plot indicate percentage of total lymphocytes. C, Increased CD4+ activated memory T cells (CD44highCD62Llow/neg) subset in p55/p75 DKO lupus mice. The numbers in the lower right quadrant of each plot indicate the percentage of CD4+CD25− cells. D, As C, but at 8–9 mo of age. Importantly, p55/p75 DKO are absent because they are dead by this age. The numbers in the lower right quadrant of each plot indicate the percentage of CD4+CD25− cells.
FIGURE 9
A, Selective gene mRNA expression of CD4+CD44highCD62Llow/neg cells from 5-mo-old female p55/p75 DKO NZM.2328 mice purified by flow cytometry ( ) in comparison with the same subset of T cells purified from age- and sex-matched C57BL/6 mice (black baseline). Data are presented as fold change values of quadruplicates tested in parallel, as described in Materials and Methods. B, Validation of the gene array data in A by real-time quantitative PCR of selected genes. Results are presented as fold change values of CD4+CD44highCD62Llow/neg cells from 5-mo-old p55/p75 DKO NZM 2328 mice (
 ), from WT NZM 2328 mice at 8–9 mo of age (□), and from WT NZM 2328 at 5 mo of age (■) compared in each case to the same subset of T cells purified in parallel from age- and sex-matched C57BL/6 mice (black baseline).
FIGURE 10
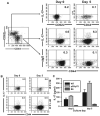
IL-17A levels in NZM2328 WT, p55/p75 DKO, and C57BL/6 mice. Naive and activated memory CD4+ spleen cells were isolated from 5- to 5.5-mo-old female p55/p75 DKO NZM 2328 mice, 7- to 9-mo-old female NZM 2328 WT mice, or 7- to 9-mo-old C57BL/6 mice by depleting B cells with magnetic beads, followed by flow cytometry sorting gated on CD4+CD62LhighCD44low (for naive T cells) or CD4+CD44highCD62Llow (for activated memory T cells). A, Naive and activated memory cells isolated from 5- to 5.5-mo-old p55/p75 DKO mice were treated as described in Materials and Methods, and stained for intracellular IL-17A and control IgG at days 0 and 5. B, Activated memory cells isolated from 7- to 9-mo-old female C57BL/6 and NZM 2328 WT mice were isolated, treated, and stained, as in A. C, IL-17A levels measured by ELISA in supernatants from cultures of activated memory T cells isolated and treated as above. Value of p < 0.001 between C57BL/6 mice and NZM2328 WT and DKO mice. No significant difference between DKO and 7- to 9-mo NZM WT.
Similar articles
- IL-17 promotes murine lupus.
Amarilyo G, Lourenço EV, Shi FD, La Cava A. Amarilyo G, et al. J Immunol. 2014 Jul 15;193(2):540-3. doi: 10.4049/jimmunol.1400931. Epub 2014 Jun 11. J Immunol. 2014. PMID: 24920843 - The Systemic Activation of Programmed Death 1-PD-L1 Axis Protects Systemic Lupus Erythematosus Model from Nephritis.
Liao W, Zheng H, Wu S, Zhang Y, Wang W, Zhang Z, Zhou C, Wu H, Min J. Liao W, et al. Am J Nephrol. 2017;46(5):371-379. doi: 10.1159/000480641. Epub 2017 Oct 26. Am J Nephrol. 2017. PMID: 29069649 - Enhancement of MHC class I-stimulated alloresponses by TNF/TNF receptor (TNFR)1 interactions and of MHC class II-stimulated alloresponses by TNF/TNFR2 interactions.
Brown GR, Thiele DL. Brown GR, et al. Eur J Immunol. 2000 Oct;30(10):2900-7. doi: 10.1002/1521-4141(200010)30:10<2900::AID-IMMU2900>3.0.CO;2-P. Eur J Immunol. 2000. PMID: 11069072 - Function of the Th17/interleukin-17A immune response in murine lupus nephritis.
Schmidt T, Paust HJ, Krebs CF, Turner JE, Kaffke A, Bennstein SB, Koyro T, Peters A, Velden J, Hünemörder S, Haag F, Steinmetz OM, Mittrücker HW, Stahl RA, Panzer U. Schmidt T, et al. Arthritis Rheumatol. 2015 Feb;67(2):475-87. doi: 10.1002/art.38955. Arthritis Rheumatol. 2015. PMID: 25385550 - T cells and IL-17 in lupus nephritis.
Koga T, Ichinose K, Tsokos GC. Koga T, et al. Clin Immunol. 2017 Dec;185:95-99. doi: 10.1016/j.clim.2016.04.010. Epub 2016 Apr 21. Clin Immunol. 2017. PMID: 27109641 Free PMC article. Review.
Cited by
- Immune and inflammatory role in renal disease.
Imig JD, Ryan MJ. Imig JD, et al. Compr Physiol. 2013 Apr;3(2):957-76. doi: 10.1002/cphy.c120028. Compr Physiol. 2013. PMID: 23720336 Free PMC article. Review. - Anti-tumor necrosis factor α treatment of interferon-α-induced murine lupus nephritis reduces the renal macrophage response but does not alter glomerular immune complex formation.
Bethunaickan R, Sahu R, Liu Z, Tang YT, Huang W, Edegbe O, Tao H, Ramanujam M, Madaio MP, Davidson A. Bethunaickan R, et al. Arthritis Rheum. 2012 Oct;64(10):3399-408. doi: 10.1002/art.34553. Arthritis Rheum. 2012. PMID: 22674120 Free PMC article. - Decipher the Immunopathological Mechanisms and Set Up Potential Therapeutic Strategies for Patients with Lupus Nephritis.
Tsai CY, Li KJ, Shen CY, Lu CH, Lee HT, Wu TH, Ng YY, Tsao YP, Hsieh SC, Yu CL. Tsai CY, et al. Int J Mol Sci. 2023 Jun 13;24(12):10066. doi: 10.3390/ijms241210066. Int J Mol Sci. 2023. PMID: 37373215 Free PMC article. Review. - Cutting edge: Leptin-induced RORγt expression in CD4+ T cells promotes Th17 responses in systemic lupus erythematosus.
Yu Y, Liu Y, Shi FD, Zou H, Matarese G, La Cava A. Yu Y, et al. J Immunol. 2013 Apr 1;190(7):3054-8. doi: 10.4049/jimmunol.1203275. Epub 2013 Feb 27. J Immunol. 2013. PMID: 23447682 Free PMC article. - Dysregulated balance of Th17 and Th1 cells in systemic lupus erythematosus.
Shah K, Lee WW, Lee SH, Kim SH, Kang SW, Craft J, Kang I. Shah K, et al. Arthritis Res Ther. 2010;12(2):R53. doi: 10.1186/ar2964. Epub 2010 Mar 24. Arthritis Res Ther. 2010. PMID: 20334681 Free PMC article.
References
- Goeddel DV, Aggarwal BB, Gray PW, Leung DW, Nedwin GE, Palladino MA, Patton JS, Pennica D, Shepard HM, Sugarman BJ. Tumor necrosis factors: gene structure and biological activities. Cold Spring Harbor Symp Quant Biol. 1986;51:597–609. - PubMed
- Beutler B, Cerami A. Tumor necrosis, cachexia, shock, and inflammation: a common mediator. Annu Rev Biochem. 1988;57:505–518. - PubMed
- Sugarman BJ, Aggarwal BB, Hass PE, Figari IS, Palladino MA, Shepard HM. Recombinant human tumor necrosis factor-α: effects on proliferation of normal and transformed cells in vitro. Science. 1985;230:943–945. - PubMed
- Kollias G, Kontoyianni D. Role of TNF/TNFR in autoimmunity: specific TNF receptor blockade may be advantageous to anti-TNF treatments. Cytokine Growth Factor Rev. 2002;13:315–321. - PubMed
Publication types
MeSH terms
Substances
Grants and funding
- R01 AR050193/AR/NIAMS NIH HHS/United States
- P30 DK04522/DK/NIDDK NIH HHS/United States
- R01 AR050193-04/AR/NIAMS NIH HHS/United States
- R01 AI057473-05/AI/NIAID NIH HHS/United States
- R01 AR057172/AR/NIAMS NIH HHS/United States
- R01 AI057473/AI/NIAID NIH HHS/United States
LinkOut - more resources
Full Text Sources
Molecular Biology Databases
Research Materials
Miscellaneous


